
The Most Easy Guide for ALL vs. ALLSELECTED in Power BI with Examples
Understanding the nuances of DAX functions in Power BI can significantly enhance your data analysis capabilities. Among these functions, ALL and ALLSELECTED are particularly powerful, allowing you to manipulate and control filter contexts in your reports. This guide aims to simplify these concepts with clear examples and practical applications.
Introduction
In Power BI, the ability to control and manipulate filters is crucial for creating dynamic and insightful reports. Two functions that play a key role in this are ALL and ALLSELECTED. While they might seem similar at first glance, they serve different purposes and can be used to achieve distinct outcomes in your data analysis.
Key Points:
- ALL Function:
- Purpose: Removes all filters from the specified columns or tables.
- Usage: Ideal for calculating totals or averages that ignore any filters applied in the report.
- Example:
CALCULATE(SUM(Sales[Sales]), ALL(Sales))will sum all sales, ignoring any filters.
2. ALLSELECTED Function:
- Purpose: Removes filters from the specified columns or tables but retains filters applied by slicers or other visuals.
- Usage: Useful for scenarios where you want to respect user selections while ignoring other filters.
- Example:
CALCULATE(SUM(Sales[Sales]), ALLSELECTED(Sales))will sum sales considering slicer selections but ignoring other filters.
Practical Applications
- Total Sales Calculation:
- Without Filters: Use
ALLto calculate total sales across all data points, regardless of any filters. - With Slicer Filters: Use
ALLSELECTEDto calculate total sales based on slicer selections, providing a more dynamic and user-responsive result.
2. Comparative Analysis:
- Overall vs. Filtered Data: Compare overall metrics with filtered metrics to gain insights into specific segments or periods.
Example Scenario
Imagine you have a sales dataset with various products, regions, and years. You want to create a report that shows:
- Total sales for the selected year.
- Total sales ignoring all filters.
- Total sales considering slicer selections.
By using ALL and ALLSELECTED, you can achieve this and provide a comprehensive view of your data.
This is how the filtering for ALL and ALLSELECTED works
Implementation in Power BI:
Here are all the steps we will be following in the step-by-step guide to help you set it up:
We will go through these steps:
1. The Table used
2. Creating the DAX for Total Sales Complete
3.Creating the DAX for Total Sales ALL
4.Creating the DAX for Total Sales ALLSELECTED
5.Data Visualization and Detailed Insights
6.Conclusion
Happy learning!

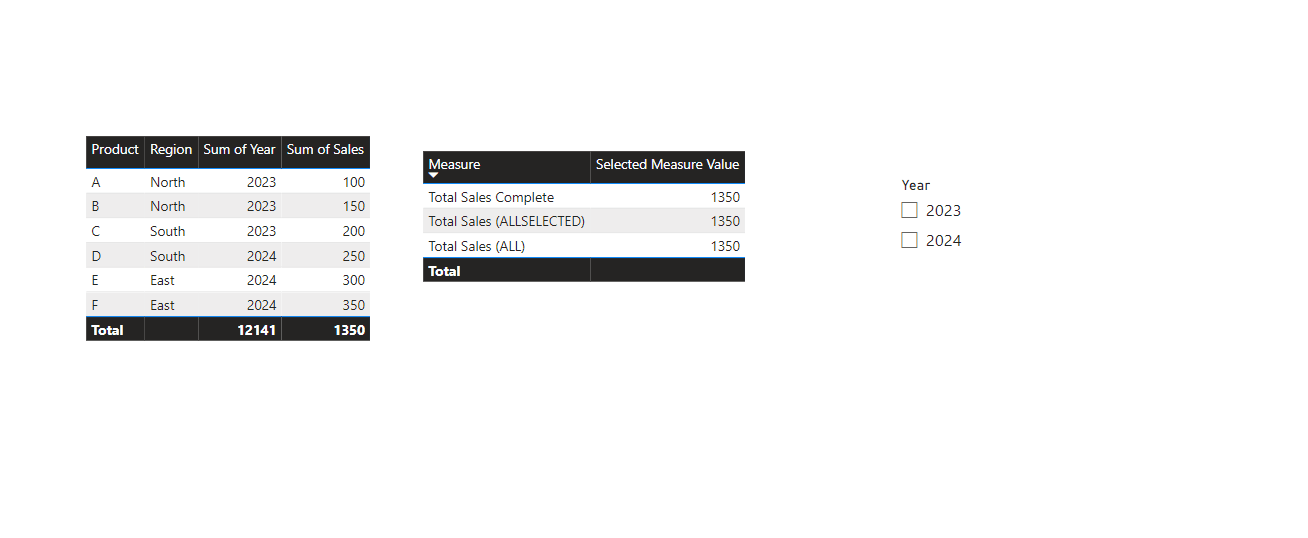
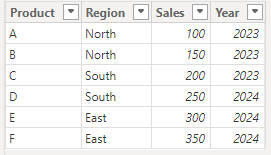
1. The Table used:
Key Points
- Products: The table lists six products labeled from A to F.
- Regions: The products are sold in three different regions: North, South, and East.
- Sales: The sales figures for each product range from 100 to 350.
- Years: The sales data is recorded for two years, 2023 and 2024.
Yearly Sales:
- 2023: Total sales for 2023 are 450 (100 + 150 + 200).
- 2024: Total sales for 2024 are 900 (250 + 300 + 350).
2. Creating the DAX for Total Sales Complete:
Total Sales Complete = SUM(ALL_vs_ALLSELECTED[Sales])

Key Points
- SUM Function: The
SUMfunction is straightforward; it adds up all the values in the specified column. - ALL_vs_ALLSELECTED Table: This table is assumed to contain sales data. The formula sums up all the sales values in this table.
Context
- Filters Applied: The formula as written includes filters. It simply sums up all the sales values in the
ALL_vs_ALLSELECTEDtable, also respects all filters applied in the report.
3. Creating the DAX for Total Sales ALL:
Total Sales ALL = CALCULATE(SUM(ALL_vs_ALLSELECTED[Sales]), ALL(ALL_vs_ALLSELECTED))

Key Points
- CALCULATE Function: The
CALCULATEfunction changes the context of the calculation by applying the specified filters. - ALL Function: The
ALLfunction removes all filters from the specified table or column, effectively ignoring any filters applied in the report.
Context
- Ignoring Filters: By using
ALL(ALL_vs_ALLSELECTED), the formula ignores any filters that might be applied to theALL_vs_ALLSELECTEDtable. This means it calculates the total sales for the entire table, regardless of any slicers or filters in the report.
4. Creating the DAX for Total Sales ALLSELECTED:
Total Sales ALLSELECTED = CALCULATE(SUM(ALL_vs_ALLSELECTED[Sales]), ALLSELECTED(ALL_vs_ALLSELECTED))

Key Points
- ALLSELECTED Function: The
ALLSELECTEDfunction removes filters from the specified table or column but keeps the filters applied by the user within the visual context.
Context
- Respecting Visual Filters: By using
ALLSELECTED(ALL_vs_ALLSELECTED), the formula respects the filters applied within the visual context but ignores other filters. This means it calculates the total sales for the selected context within the visual, considering only the filters applied by the user.
5. Creating the table and filter:
1. Creating the Table
- Add Table from Visualizations.
- Add Product, Sales, Year and Sales in Columns section.
- In Format visual → Visual → Layout and style presets → Style → Alternating rows.
2. Creating the Slicer
- Add Slicer from Visualizations.
- Add Year in Field section.
- In Format visual → Visual → Style settings → Style → Vertical list.
3. Creating the Result Table and Selected Result Measure
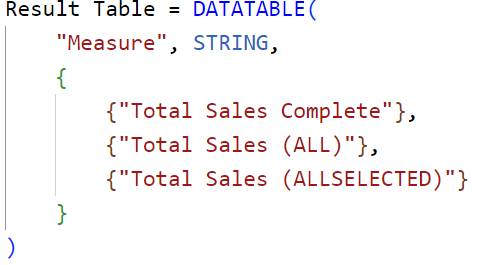
Result Table = DATATABLE(
“Measure”, STRING,
{
{“Total Sales Complete”},
{“Total Sales (ALL)”},
{“Total Sales (ALLSELECTED)”}
}
)
- In Modelling tab select New table.
- Add the DAX mentioned above and click on Commit.
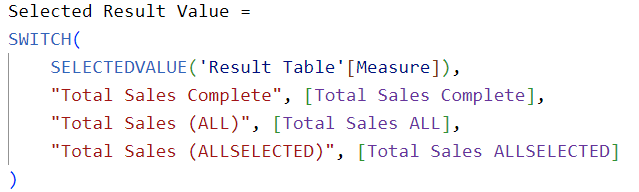
Selected Result Value = SWITCH( SELECTEDVALUE(‘Result Table’[Measure]), “Total Sales Complete”, [Total Sales Complete], “Total Sales (ALL)”, [Total Sales ALL], “Total Sales (ALLSELECTED)”, [Total Sales ALLSELECTED] )
- Add Table from Visualizations.
- Add Measure and Selected Result Value in Columns section.
- In Format visual → Visual → Layout and style presets → Style → Alternating rows.
Finally you can use the filters to control the values displayed in the table.
As you can see below the Total Sales Complete and Total Sales (ALLSELECTED) respect the filters so when we apply filter for 2023 then it is considering only the values of 2023 so we get total of 450 and for Total Sales (ALL) which ignores all filters we get 1350 which is the total without any filters.
Conclusion
Regular SUM → Respects all filters
ALL → Ignores all filters
ALLSELECTED → Respects the filters applied within the visual context but ignores other filters, in general Respects Filters
Thank you for your attention!
Follow me or subscribe to get all my Power BI articles!
Don’t forget to subscribe to
👉 Power BI Publication
👉 Power BI Newsletter
and join our Power BI community:


