
The laws of nature strongly influence product behavior

In a previous post, we discussed how to select the best metric to drive a product’s success, and we explained why the vision of the product is one of the biggest determinants for selecting a topline metric.
People behave in ways that are governed by the laws of nature. We are all social people and mimic each other’s behavior and are more likely to follow similar patterns of behavior. As a result, all the possible behaviors in the theoretical spectrum of what is possible do not occur with the same probability in nature. In this post, we’ll show how the laws of nature strongly influence the behavior of users and ultimately the success of a product.
Our findings are based on analyzing data from App Annie across three different types of apps: large consumer apps (apps with more than 1 million MAU), small consumer apps (apps with less than 100,000 MAU) and top-performing, category-defining apps such as Spotify, Yelp and Waze.
Large Consumer Apps
Figure 1: Measuring Product Stickiness for Large Consumer Apps
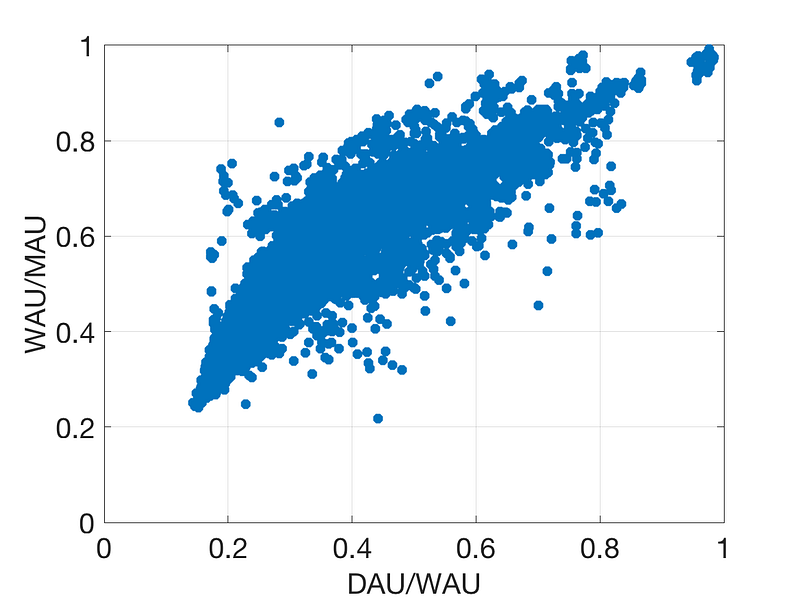
It is hard to grow products to really large sizes. Less than 15% of the products that reach 100k MAU, get to over a million monthly active users. Obviously, this percentage is much smaller if we consider all products (regardless of size). As products grow bigger, there are specific pathways that get them to large active user sizes that are governed by laws of nature. We investigate this by understanding the product’s stickiness.
In Figure 1, we plot DAU/WAU versus WAU/MAU, where DAU/WAU is the aggregate percentage of days in a week that users engage with a product and WAU/MAU is the aggregate percentage of weeks within a month that users engage with a product. Products with higher ratios of WAU/MAU and DAU/WAU are at the top right of the chart and are the stickiest. In contrast, products with the lowest WAU/MAU and DAU/WAU ratios are at the bottom left and are the least sticky.
Our analysis yielded two key findings:
- Weekly products are also daily products. Among the large consumer apps we analyzed, there is a strong correlation between DAU/WAU and WAU/MAU. This means that as DAU/WAU increases, so does WAU/MAU, and vice versa. In other words, as products become stronger weekly products they appear to do so through increased daily usage. This is very likely due to the laws of nature. People who use products daily also use them on a weekly basis. On the other hand, if one uses a product weekly, it is more likely for a specific utility that is not habit-forming. Furthermore, there is a negligibly small number of strong weekly products (high WAU/MAU) with low daily usage (low DAU/WAU).
- Few outliers exist. Upon further investigating which products have strong weekly usage but low daily usage (which we defined as WAU/MAU > 0.6 and DAU/WAU < 0.3), we found that all apps are outliers. These are primarily designed for occasional or periodic use but serve no purpose to be used every day. For example, T-Mobile Tuesdays app sends a notification every Tuesday to users giving them access to special deals. Unsurprising, this product is largely used only once a week. LastPass Password Manager, and Period Tracker are also specific utility apps that are not designed to be used every day. Therefore, while it is possible to be a strong weekly product and have low daily usage, these tend to be outliers.
Small Consumer Apps
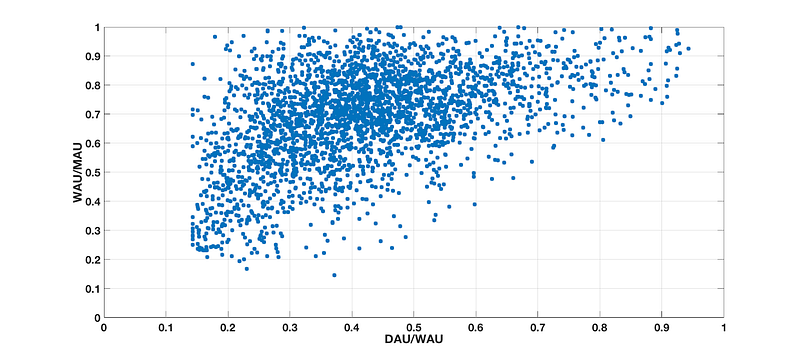
We define small consumer apps as those whose monthly active users are less than 50,000. In Figure 2, we plot the DAU/WAU and WAU/MAU ratios for small consumer apps. Two key findings:
- There is a larger spread in behavior. Many more products that are weekly but not daily — the laws of nature seem to dictate that It is much easier for a small consumer app to get to a strong weekly-used product but not a daily product. As a result, there are many more products that have high WAU/MAU and relatively low DAU/WAU.
- There are no outlier products that are daily but not weekly — It appears that it is impossible for both small and large products to be a daily product and not a weekly one. So, if you are using a product every day, you are almost certainly going to come back the next week.
Figure 2: Measuring Product Stickiness for Small Consumer Apps
Category-Defining Apps
In addition to large and small consumer apps, we examined apps that are at the top of their categories in terms of usage, from music to maps to photos. We again plotted the DAU/WAU and WAU/MAU across these different categories.
The products we used in this analysis with the top DAU/MAU ratios in their category and a minimum of 1 million MAU are as follows:
- Social: Facebook, Snapchat, Instagram
- Travel: Gas Buddy, Airbnb, Yelp
- Music: Spotify, Pandora
- Maps: Waze, Apple Maps, Google Maps
- Communication: WhatsApp, Kakao Talk, iMessage
- Photography: Samsung Gallery, Google Photos
Figure 3: Measuring Stickiness for Category-Defining Apps
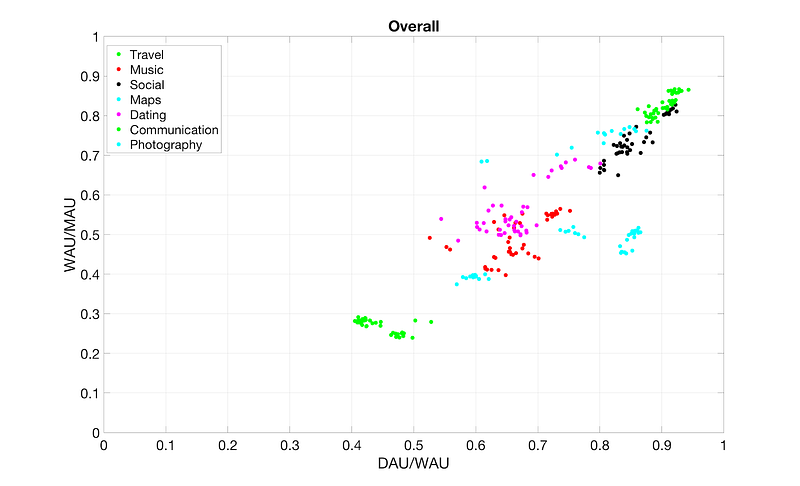
Our analysis revealed four key insights:
- Usage across categories varies substantially. Unsurprisingly, usage varies across categories. The top communication products have very high DAU/WAU and WAU/MAU ratios while the best mapping products have much lower daily and weekly usage ratios. This implies that every product has a limit on how frequently it is used that strongly depends on its use case.
- The best products in each category are clustered. Interestingly, the best products in each category are all clustered, implying that the specific use case determines product stickiness to a large extent. The laws of nature appear to group each category and sets limits on how sticky a product can be.
- The best products all fall on a line. Regardless of the category, the best products are all on one line. This may imply that the best products evolve along this line as they grow from being a small usage product to a large one. (see Figure 4)
- Products with high monthly usage do not need to be highly sticky. There are numerous products that reach a scale of tens of millions of users yet do not have particularly high WAU/MAU ratios. This indicates that a product’s maximum DAU/MAU is limited by the use case and its associated total addressable market.
Usage Evolution of Category-Defining Apps
Finally, we analyzed the evolution of one category-defining product. Figure 4 shows the evolution of Instagram from 2014 to 2019.
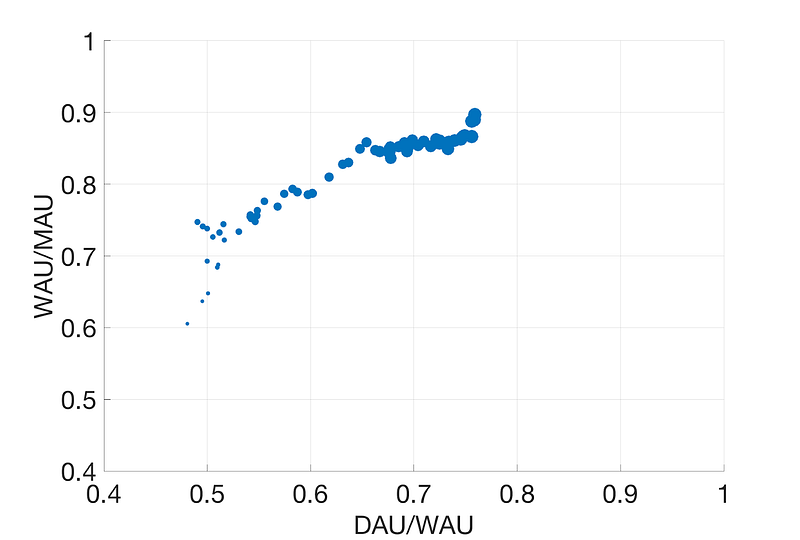
The key insights from analyzing how Instagram (in India) evolved include the following:
- Fewer users correspond to lower usage. During the five-year period from 2014 to 2019, Instagram’s MAUs increased from 9 million to 110 million. Initially, both the DAU/WAU and WAU/MAU ratios were small. As the number of users increased, the product became stickier, and both the DAU/WAU and WAU/MAU increased.
- Initially, Instagram was a weekly product. In 2014, people used Instagram on a weekly basis but not necessarily a daily one. This is illustrated by the way in which the WAU/MAU ratio increased much faster than the DAU/WAU ratio.
- As Instagram matured, it became a daily product. As more people started using Instagram, it became a strong weekly product and then transitioned into a daily product, with DAU/WAU increasing at a much faster rate than WAU/MAU. As the product became more penetrated (with respect to the overall eligible population), MAU penetrates first followed by WAU and then DAU. As a result, DAU/WAU increases with WAU/MAU holding relatively steady.
- Pathway to product success. There appears to be a pathway for a product to succeed. Stickiness begins relatively high; becomes a strong weekly product; gains strength as both a daily and weekly product; after reaching higher weekly penetration the product continues to become a stronger daily product until it reaches a maximum on both daily and weekly stickiness.
We explored the evolution of Instagram. The pathways of other social products are similar. In order to extend this understanding to other categories of products, we need to develop a framework for the same. But undoubtedly, each category of product has specific pathways to product success.
Implications for Product
- Knowing the category of your product, one can identify the pathway(s) for success and develop an understanding of whether the product is on track for success. However, this does not tell you how to succeed.
- Tactically, for the category of products that have daily use cases, product teams should try to set goals as daily products as opposed to weekly.
- Product teams need to identify the theoretical maximum for their specific use cases and determine the right strategies and roadmap to get there. Benchmarking your product against the best-in-class product in the relevant category is ideal.
This work is a product of Sequoia Capital’s Data Science team. See the full data science series here. Please email [email protected] with questions, comments and other feedback.


