
The Heart of Mathematics
The alien beauty of the Mandelbrot set and its mysterious cousins
It has been dubbed “the fingerprint of God” and is in my opinion one of the most interesting and beautiful objects in mathematics. Not only is it interesting, it is also beautiful.
In this short article, we will see what this mysterious set really is and why it is important, we’ll discuss why it is still not very well understood, and we will explore this amazing fractal together through stunning images.
To show you the beauty of this alien geometry, I have embedded a 20K image in this article (not the featured image), that is, the image comprises 200 megapixels. However I am not sure if this platform preprocesses it before hosting it so to make sure that you don’t miss out, I have shared a link at the end of this article where you can download a VERY sharp image.
In fact, the image I have linked to is a 76K image (containing more than 3 billion pixels) of the Mandelbrot set! It is so big that many image viewers crashed when I tried to open it. But of course, 20K is more than enough unless you want to wrap the image around a building or create an enormous poster - in that case, give me a call and we’ll figure something out.
For the interested reader, I have written a program in the modern and performant programming language Rust that you can use to create your own images of arbitrary size (though limited by the amount of RAM on your machine).
This program also lets you play around with other fractals that you define yourself but more about that later.
The Mandelbrot set
Before explaining what the Mandelbrot set is, let’s start with an amazing and true story. The set itself was first drawn in 1978 and the first published version was the following image:
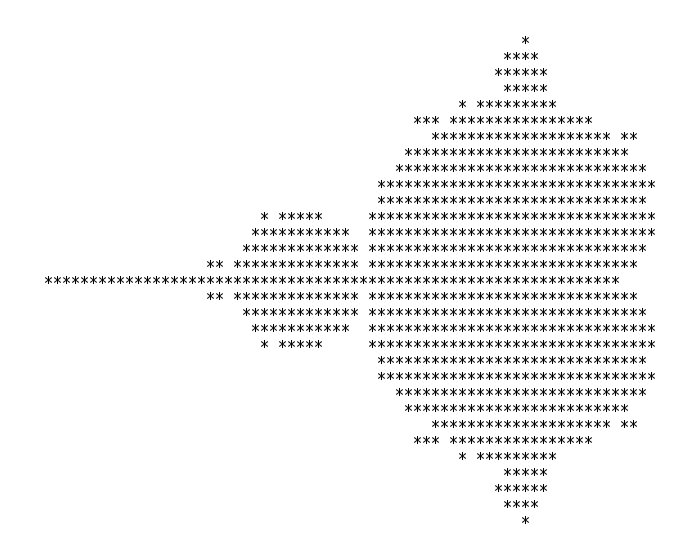
It is clear that this was a rough sketch and it showed a curious shape but no one dared dream about the details and intricacies later found near its boundary. Two years after this image was released, Benoit Mandelbrot, an applied mathematician working at IBM at the time was trying to code a computer to visualize this set in greater detail.
The story goes that Mandelbrot had a computer print out the set that appeared as having several disconnected smudges that looked like ink stains so some of the personnel would try to clean the paper before it reached Mandelbrot himself. This made him confused at first until he found out what was going on. And he asked them to “stop cleaning the paper!”.
When more detailed images were printed out on paper, it was clear that there were a lot more details than initially assumed. At the time, nobody could have guessed that this set would become one of the most famous and well-recognized geometrical figures in all of mathematics.
Into complexity
If we ask Wikipedia about the Mandelbrot set is, we get the following answer:
“The Mandelbrot set exhibit an infinitely complicated boundary that reveals progressively ever-finer recursive detail at increasing magnifications; mathematically, the boundary of the Mandelbrot set is a fractal curve.”
- Wikipedia
In the following sections, we will see where this beast comes from and why it is important to study it but I think that it is also very important to have the following in the back of your mind when reading: namely the simple fact that it’s real.
I think the hands-down most fascinating thing about the Mandelbrot set is that it is a real thing! It is really there and it contains valuable information about a certain mathematical function (I will tell you what this means in a bit).
One can easily become lost in the mesmerizing ‘free falls’ toward the boundary of the set as if navigating through a surreal dream. Yet, the boundless intricacies and details are firmly rooted in mathematical reality. It is a true piece of geometry.
The first thing to understand when talking about the Mandelbrot set as a geometrical shape is that it is drawn in a two-dimensional space known as the complex plane (Don’t worry - this will not turn into an article about complex numbers but we need to know the very basics).
A complex number is simply a number of the form a + bi where i is an algebraic symbol with the property that i² = -1. So what you are actually looking at when you look at the Mandelbrot set are complex numbers represented in a coordinate system.
When you read the words “coordinate system”, you are probably thinking about the plane where we plot graphs of functions or points. The “usual” coordinate system where the two axes represent the input space or domain (x-axis) and the output space or image (y-axis) of a certain function and that is fine but that is just a representation of the geometry of the function.
Points and vectors can also be represented in a coordinate system. In the same way, any complex number z = a + bi can also be represented in a coordinate system by the point (a, b). This representation is very meaningful because multiplication and addition of complex numbers have a geometric meaning where the corresponding points in the plane get multiplied and summed together.
For example, the distance from the point representing the complex number z and the origin is called the modulus and is denoted by |z|. This distance function has many useful properties.
How is the Mandelbrot set defined?
Consider a function of a complex variable f(z) = z² + c where c is some constant complex number. Now we iterate over that function starting with z = 0 and feed the result back into the function. We continue like this to get a sequence of numbers. If that sequence goes to infinity, then the number c is not part of the Mandelbrot set and if it is bounded, then it is part of the Mandelbrot set.
For instance, if c = 1, then the sequence starts 1, 2, 5, 26, … which blows up. However, if we start with c = -1, then we get the sequence -1, 0, -1, 0, … which is clearly bounded, so c = -1 is part of the Mandelbrot set.
It turns out that if one of the complex numbers a in the sequence has modulus |a| > 2, then the sequence will eventually tend to infinity. The number of steps it takes to get to a number with modulus greater than 2 is known as the escape time of c. When this happens, we don’t need to compute any more numbers in the sequence because we know that the number is not part of the set.
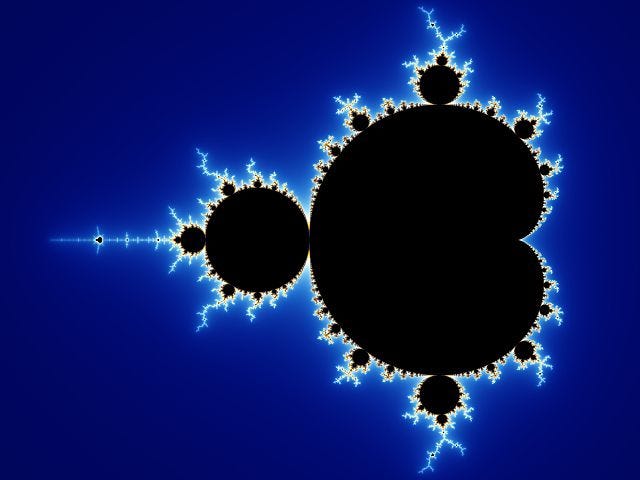
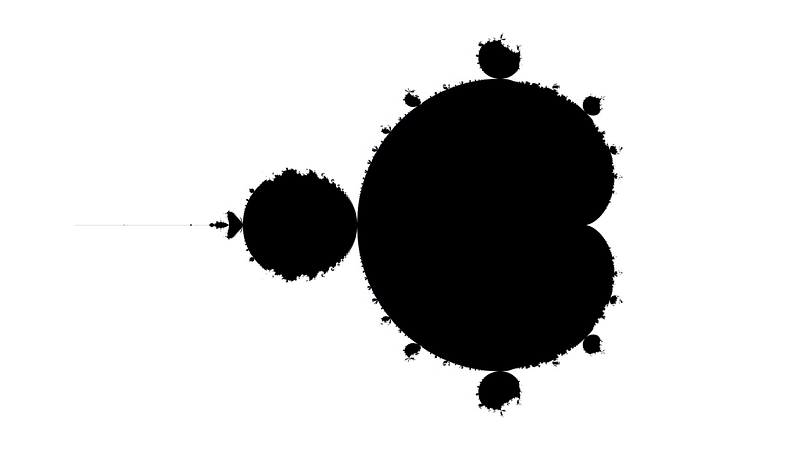
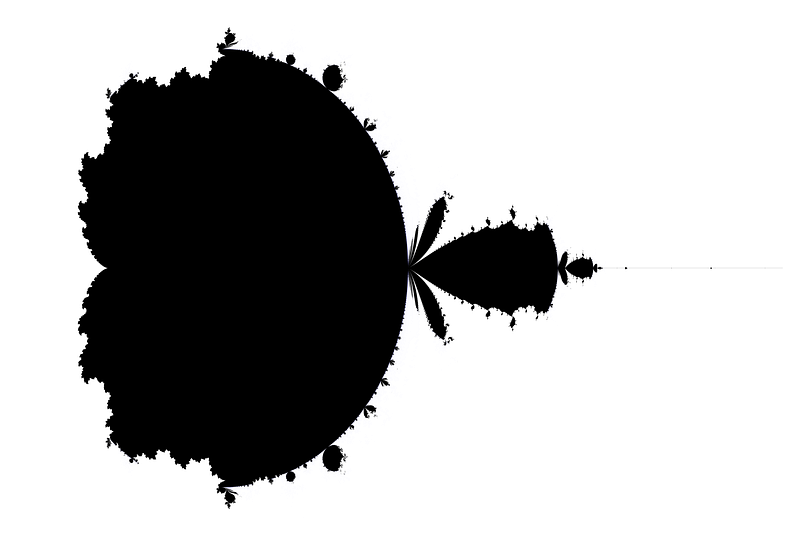
When we plot the points representing the complex numbers bounded under the iteration of this map in the complex plane, we get the following image:
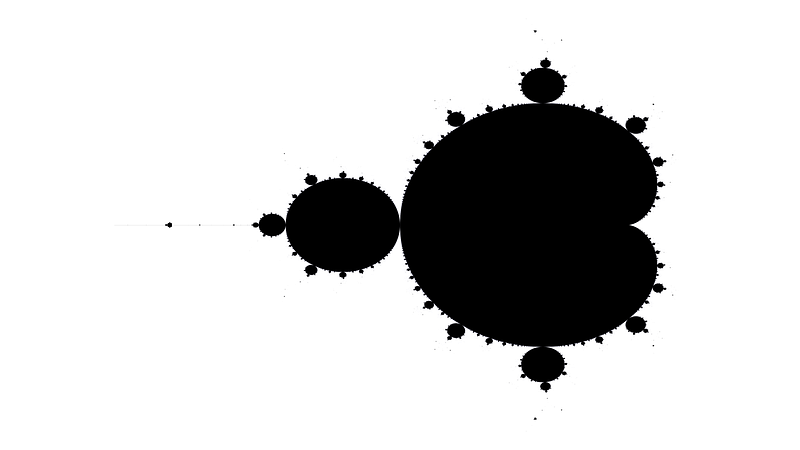
That was exactly what Mandelbrot did, we have just displayed a more detailed image here. Try to compare this image to the first published image.
If you look closely you find small baby-mandelbrot sets all over the place. This is the tell-tale sign of a fractal. A geometrical shape that displays self-similarity. Some of them actually look like small detached islands but amazingly it has been proved that the Mandelbrot set is in fact connected, meaning that you cannot separate it into two or more disjoint subsets without cutting through it.
We don’t know if it is locally connected though which requires a bit more technical machinery to explain.
What does infinite complexity mean?
It means that as you get “close” to the boundary, very small changes to the initial point c result in big changes to the output (escape time). In a mathematical sense, calculating the actual “boundary” would require an infinite amount of iterations of the map.
Exploring the Mandelbrot set
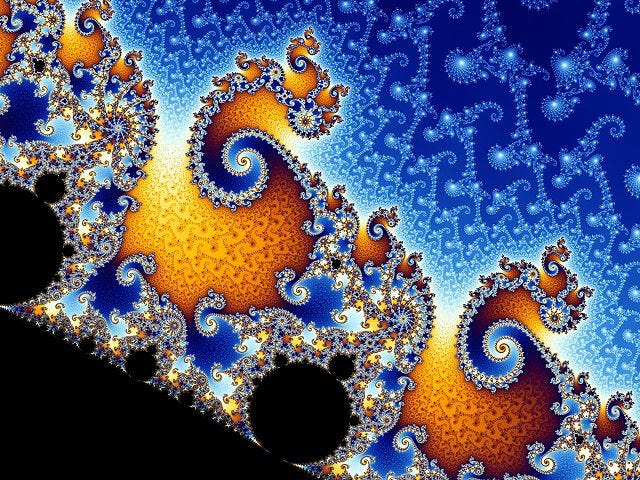
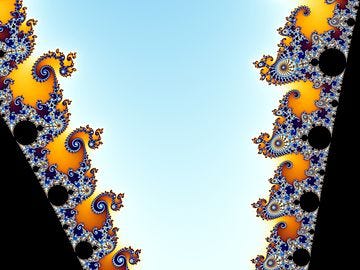
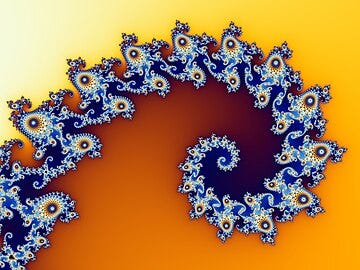
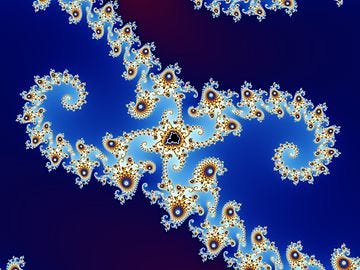
As we zoom in on this set, it gets more and more detailed with many small versions of itself with only minor differences. By coloring the set in different ways, we can appreciate the different shapes it takes.
It’s like Hubble’s deep field photos of a small part of our Universe containing billions of galaxies which comprise billions of stars each, except that a small subset of the Mandelbrot set literally contains an infinite amount of small baby Mandelbrot sets together with an infinite amount of additional structure.
Exploring the mandelbrot set can be quite addictive. It turns out that many interesting sequences of natural numbers appear quite naturally such as the odd numbers, the Fibonacci numbers, etc.
Moreover, even though the set is self-similar, different regions reveal completely different and seemingly new shapes. Below we see some examples of this:


As promised, I have created a 76K image of the Mandelbrot set which you can download here.
The code
The code that I wrote and used to generate the Mandelbrot set can be found here:
Note that the threshold of 10.000 is how many iterations we want to loop through before determining if the given point is inside the set. The higher this number, the more certain we will be that it is in fact contained in the set, but of course the higher the threshold, the higher the run time of the program.
We can also try out different functions than f(z) = z² + c. Feel free to steal this code and play around with it. Notice that I have used the library Rayon to parallelize these computations across the cores on the computer. You don’t have to do that of course as it might be an idea to look out for memory usage.
Note that different functions might require different modulus bounds for determining the escape time.
If we choose f(z) = z(z+1)/2 + c, we get the following weird fractal which looks a little like a jagged Mandelbrot set:
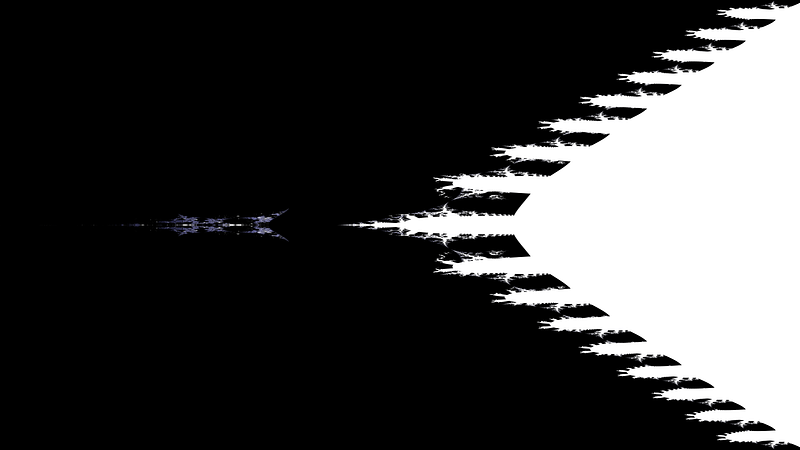
If we use f(z) = e^(-z) + c, we get the following fractal with “leaves” on it:
This set displays a vertical symmetric structure.
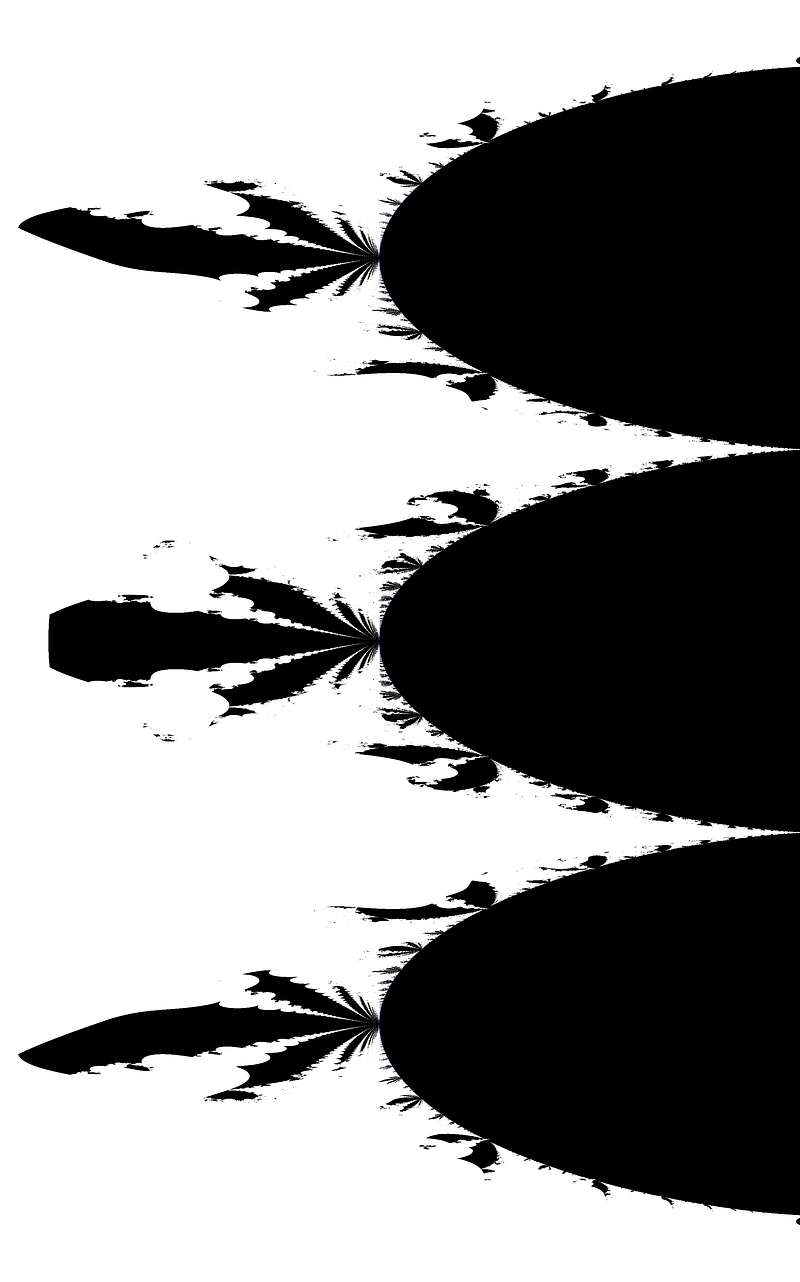
One of my favorite functions to iterate is the logistic function f(z) = z(1-z) + c which looks like the following:
This fractal has a wealth of details when we zoom in. I generated a 20K image of this fractal and zoomed in on the top of the fractal:

I can stare at this image for hours! There are incredibly many details.
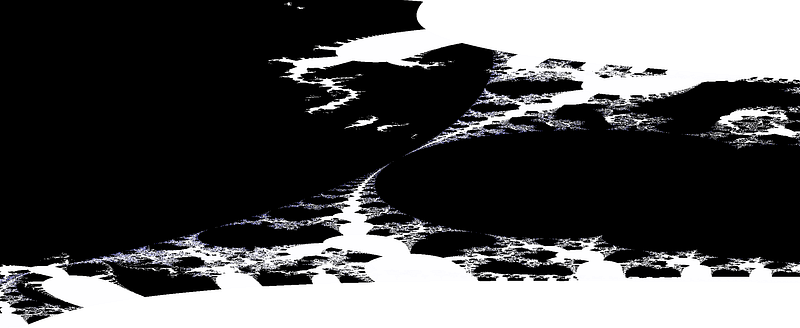
The iterated gamma function f(z) = Γ(z+1) + c also generates a fantastic fractal:
Which, if we zoom in on the middle spike, reveals a world of complexity! Just look at this:
The Mandelbrot set and all these other cousins remind me of a beautiful poem by William Blake.
“To see a world in a grain of sand and a heaven in a wild flower. Hold infinity in the palm of your hand and eternity in an hour”
- William Blake
It is interesting that even though the Mandelbrot set is clearly bounded (by e.g. |z| < 2), it still holds an infinite amount of information and we mortal humans will never be able to plot the full set. That is, despite the fact that this beetle-like shape lives inside a closed disk of radius 2!
So it is really like holding infinity in the palm of our hands.


