The Fibonacci Trading Method — The Full Guide.
Fibonacci & Trading, How is it Used?
We often hear a lot about Fibonacci in trading and yet we do not know that there are lots of ways to apply the famous sequence in trading. In this article, we will try to cover as much as possible of Fibonacci’s relevance to the world of investing and trading.
I have just released a new book after the success of the previous book. It features advanced trend following indicators and strategies with a GitHub page dedicated to the continuously updated code. Also, this book features the original colors after having optimized for printing costs. If you feel that this interests you, feel free to visit the below Amazon link, or if you prefer to buy the PDF version, you could contact me on LinkedIn.
The Fibonacci Sequence
Leonardo Bonacci also known as Leonardo Fibonacci (which is a nickname to say son of Bonacci), has created one of the most fascinating series in our universe using simple addition techniques while observing rabbit populations. Now, to be fair, there is some evidence that suggest Indian mathematicians knew this sequence beforehand, we will stick to the widely accepted fact that Fibonacci came up with the sequence (Although, knowing the bright scientific and mathematical history of Indian researchers, I would not be surprised to know that they were the ones who discovered it first).
Fibonacci numbers are simply obtained using the following simple formula for n > 2:
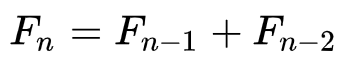
This gives us the following sequence that goes to infinity:
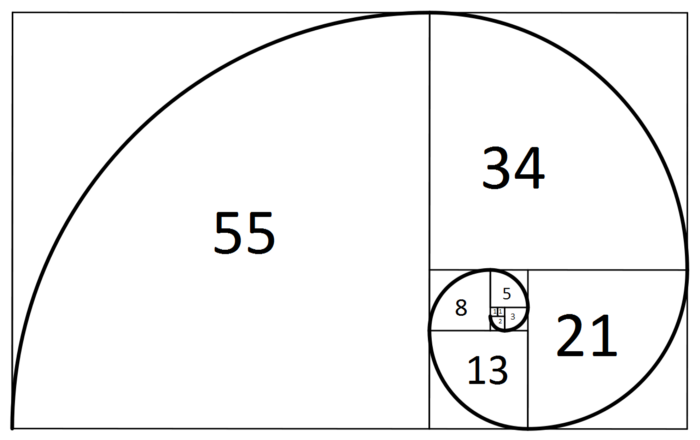
1, 1, 2, 3, 5, 8, 13, 21, 34, 55, 89, 144, ….
The beauty of this sequence is that it is related to nature. For example, it appears the flowering of the artichoke, some flower petals such as Daisies, honeybees, etc.. Does it even occur in the galaxy spirals?
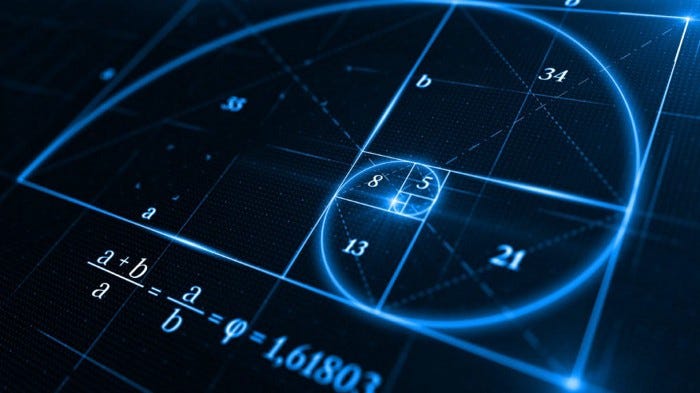
There is even a very interesting observation based on facts that suggests that the dimensions of the Earth and Moon are in Phi relationship, forming a Triangle based on 1.618, by Gary Meisner. But what is Phi, and what is this 1.618?
If we take any two successive numbers in the sequence, their ratio (Xn / Xn-1) gets closer to 1.618 which is what we call the golden ratio: 3 / 2 = 1.5 13 / 8 = 1.666 55 / 34 = 1.61764 233 / 144 = 1.61805 … 317,811 / 196,418 = 1.61803
Going to infinity, the ratios get closer to 1.618, also known as Phi (ϕ). The beauty of this number is that its reciprocal is 0.618. This is the most important ratio in Fibonacci trading.
The sequence and the ratio (as well as its variations) are heavily used in trading. The below is a quick summary of how they are used:
- The sequence: Choosing lookback periods of technical indicators such as 8-period moving averages or 21-period RSI.
- The ratios: Retracing back a certain Fibonacci ratio such as 61.8% or 38.2%.
Medium is a hub to many interesting reads. I read a lot of articles before I decided to start writing here. Consider joining Medium using my referral link!
Fibonacci Retracements
This is the simplest technique to find support and resistance levels after an initial reaction move. Generally, we tend to look at the following ratios as support or resistance levels:
- 38.2%: This level is found as the square of 61.8%.
- 50.0%: This is not really a Fibonacci level, but we generally see it around them. It is simply half the distance of the initial reaction.
- 61.8%: This is the most important level. We tend to expect reactions when the market reacts back to this level. Generally, we have a better conviction on this level than on other levels.
- 78.6%: This is the first square root of 61.8%. It acts as a support and resistance level in triangles.
- 88.6%: This is the second square root of 61.8%. It is a slightly more powerful support and resistance level than the previous level 78.6%. Some reactions tend to be powerful close to this level.
- 161.8%: This is the golden ratio where the retracement of a move is below it (if the initial reaction is bullish) and above it (if the initial reaction is bearish). We have the same conviction of a reaction as the 61.8% retracement.
- 224.0%: This is a ratio presented by Scott Carney in his books. It is simply the summation of the golden ratio and its reciprocal. It is used as a powerful reactionary level, especially with harmonic patterns.
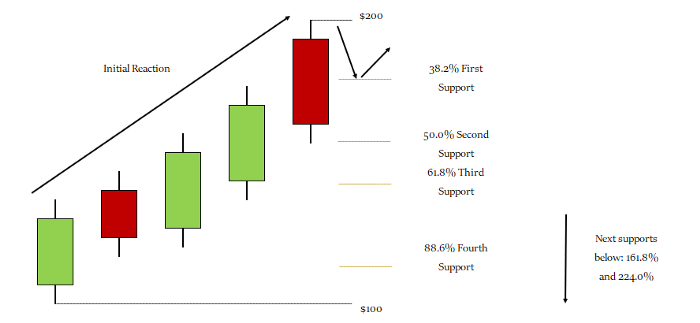
The above illustration shows how retracements are drawn. For example, from the low of $100 to the high of $200, we would expect to find strong support at $138.20 which is the 61.8% retracement of the whole initial move.
Although, extreme accuracy does not exist in finance and trading, we should however try to approach it with any means we have and that in turn requires us to use candlesticks in order to retrace the upswing from its real bottom (i.e. the low of the first candle in the upswing) until the highest point of the suspected end of the wave (upswing).
If you are also interested by more technical indicators and strategies, then my book might interest you:
Fibonacci Projections
Fibonacci projections are similar to projections only they are projected using three points rather than just two. Generally, we tend to look at the following ratios as projected support or resistance levels:
- 61.8%: This is the second most important level. We tend to expect reactions when the market reacts back to this level.
- 100%: This is what is called an ABCD pattern. It is the most important projection and will be explained in details below. Basically, it is a zig zag movement with the first and third leg being equal in length.
- 161.8%: This is the golden ratio where we expect at least a reaction on the projections.
- 224.0%: This is a ratio presented by Scott Carney in his books. It is simply the summation of the golden ratio and its reciprocal. It is used as a powerful reactionary level, especially with harmonic patterns.
The above illustration shows how projections are drawn. For example, from the low of A to the high of B and projecting the distance as of the low of C, we would expect to find a resistance at the D point which is AB = CD leg.
If you want to see more articles relating to trading strategies, consider subscribing to my DAILY Newsletter (A Free Plan is Available) via the below link. It features my Medium articles, more trading strategies, coding lessons related to research and analysis, also, subscribers get a free PDF copy of my first book. You can expect 5–7 articles per week with your paid subscription and 1–2 articles per week with the free plan. This would help me continue sharing my research. Thank you!
Fibonacci Fans
The Fibonacci fans resemble the Fibonacci retracements more than the projections in that they are based on internal distance. We use them exactly the same way as retracements as shown in the below plot.
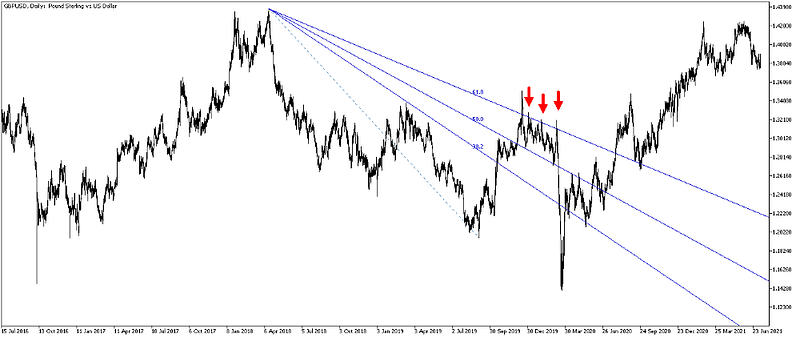
The way they are calculated is by going from trough to peak or from peak to trough, then the ratios are found by dividing the difference between the extreme peaks and troughs by the Fibonacci ratios such as 61.8% which when calculated at every time point gives us the Fibonacci fan.
Fibonacci Time Zones
The time zones take a different approach by being vertical in nature and more related to time than price. They are less useful than its other Fibonacci peers but it remains interesting to understand how they are drawn and what do they signify. The below chart shows the Fibonacci time zones after drawing a line from point A to point B. After that we will encounter vertical lines which follows the Fibonacci sequence.
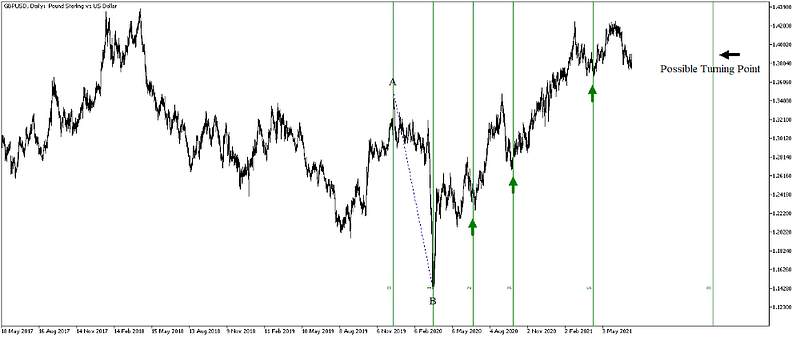
Every vertical line should warn of a possible reversal of the current mini trend. It is advisable that the signals to be taken into account come after the 5th time period. Anything before it may be unreliable.
The ABCD Pattern
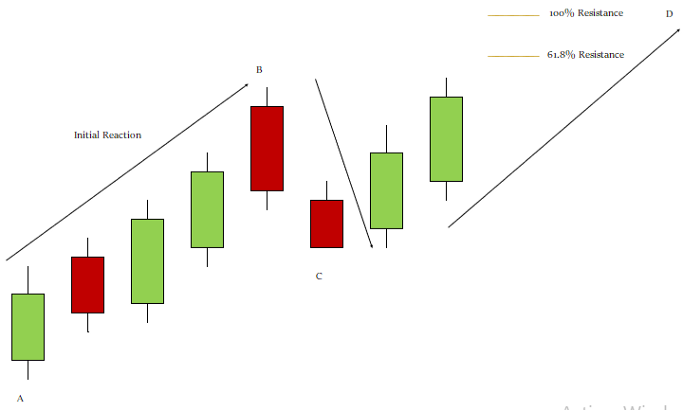
The ABCD pattern is the most basic symmetrical configuration in the market. It is based on a same length wave where a reversal is expected at the end of the second leg. The details of the pattern can be found as follows:
- A first leg impulsive leg should occur where a retracement is to be expected, preferably 61.8% but not mandatory.
- The reaction from the first retracement should equal the first leg.
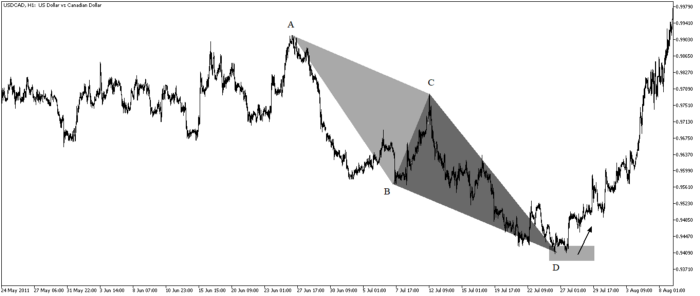
The figure above shows a powerful reaction after prices reached the potential reversal area which is defined as the end of the CD leg. The CD leg equals the AB leg in amplitude. The advantage of the ABCD pattern is that it is easy to detect and looks like a simple Zig Zag.
The pattern is always composed of four points in time ABCD where we trade the last point.
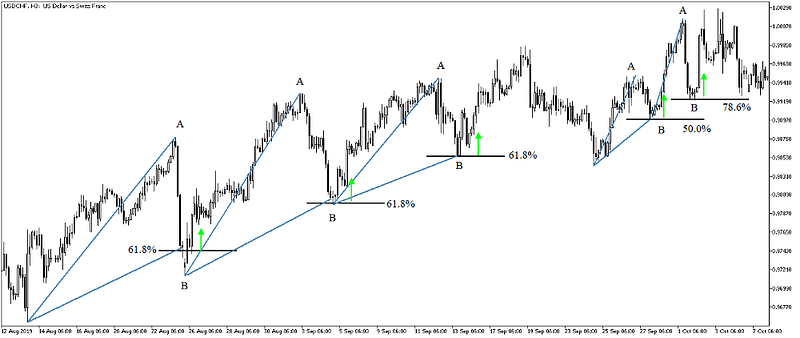
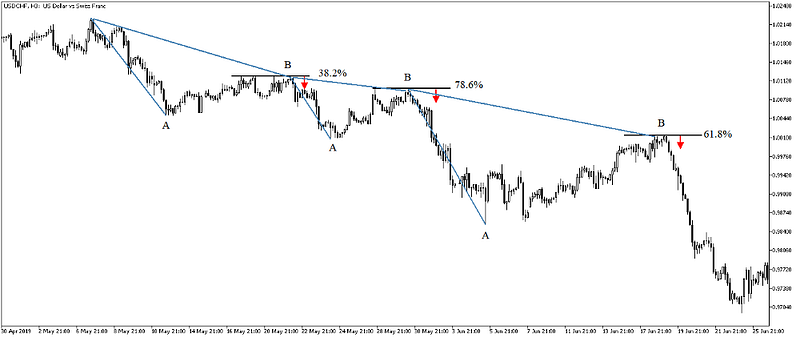
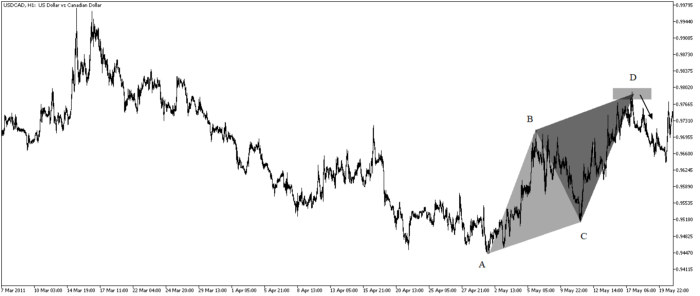
The ABCD Pattern can start to be detected around mid-way between point C and point D where the market price breaks (or surpasses) the low (or high) of the B point. Therefore, we have enough time to act on it without any hindsight bias or delay. The below plots show how to detect one across time:
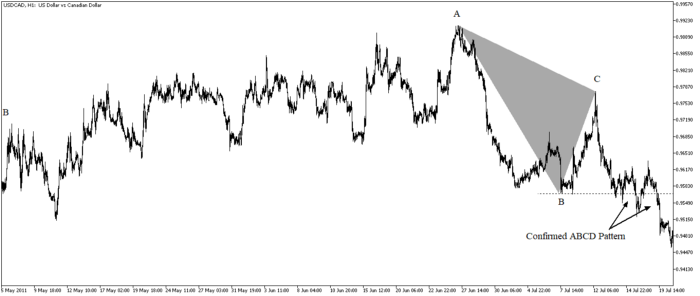
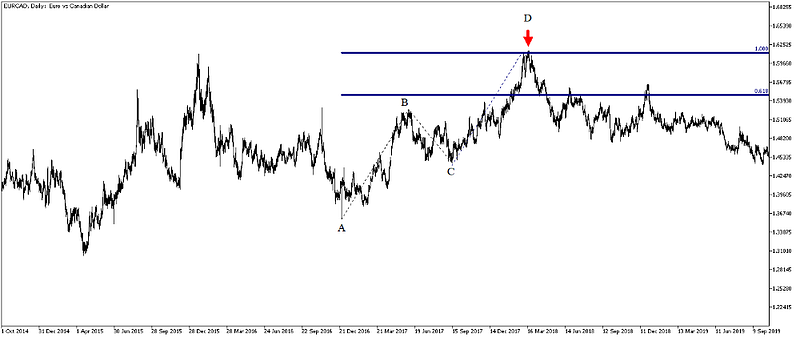
Then, we basically calculate the same distance of the AB leg starting from the C point. This will give us the CD leg, the projected reversal level.
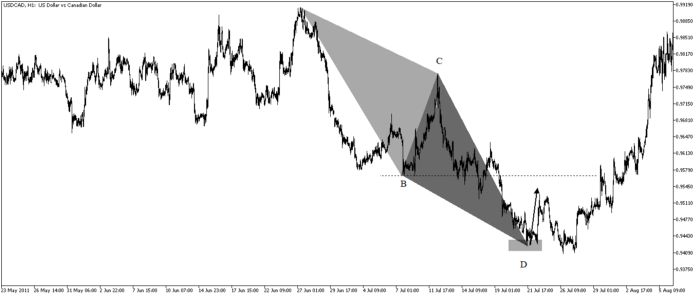
Having reached close to the D point, the pattern becomes clear and should show clearly the reversal level as outlined in the chart above. All we need is the expected reaction from the D point. And finally, we should manage the reaction according to the risk management measures.
Remember to always do your back-tests. You should always believe that other people are wrong. My indicators and style of trading may work for me but maybe not for you.
I am a firm believer of not spoon-feeding. I have learnt by doing and not by copying. You should get the idea, the function, the intuition, the conditions of the strategy, and then elaborate (an even better) one yourself so that you back-test and improve it before deciding to take it live or to eliminate it. My choice of not providing specific Back-testing results should lead the reader to explore more herself the strategy and work on it more.
One Last Word
I have recently started an NFT collection that aims to support different humanitarian and medical causes. The Society of Light is a set of limited collectibles which will help make the world slightly better as each sale will see a percentage of it sent directly to the charity attributed to the avatar. As I always say, nothing better than a bullet list to outline the benefits of buying these NFT’s:
- High-potential gain: By concentrating the remaining sales proceedings on marketing and promoting The Society of Light, I am aiming to maximize their value as much as possible in the secondary market. Remember that trading in the secondary market also means that a portion of royalties will be donated to the same charity.
- Art collection and portfolio diversification: Having a collection of avatars that symbolize good deeds is truly satisfying. Investing does not need to only have selfish needs even though there is nothing wrong with investing to make money. But what about investing to make money, help others, and collect art?
- Donating to your preferred cause(s): This is a flexible way of allocating different funds to your charities.
- A free copy of my book in PDF: Any buyer of any NFT will receive a free copy of my latest book shown in the link of the article.