
The Everything Bubble

Let me set the scene. The Nasdaq, Dow, S&P 500, and Russel 2000 have reached all-time highs, up substantially on a YoY and 5-year basis. VCs are pouring money into startups at an unprecedented rate. Metrics around valuations have become so irrational that they are simply ignored. Every company that can possibly go public is, with a new unicorn skyrocketing out of the gate on a daily basis. Home prices are 24% higher than they were pre-pandemic, resulting in the fastest rate of home price appreciation ever. Bonds have reached new all-time highs after being artificially inflated by the fed’s quantitative easing. Cryptocurrencies have skyrocketed, with prices as much as 50 to 100 times greater than they were a year and a half ago. NFTs have become a multi-billion dollar industry that was nonexistent 4 years ago.
I think we all know how this is going to end. Yet nobody bats an eye and the ones who do are disregarded because they are “irrational”. This is what makes the current state of the market so dangerous. An enormous bubble has formed right in front of our eyes, yet nobody is talking about it.
I have coined it “The Everything Bubble” precisely because irrational exuberance has spread into every possible financial industry. Put differently, euphoria is everywhere.
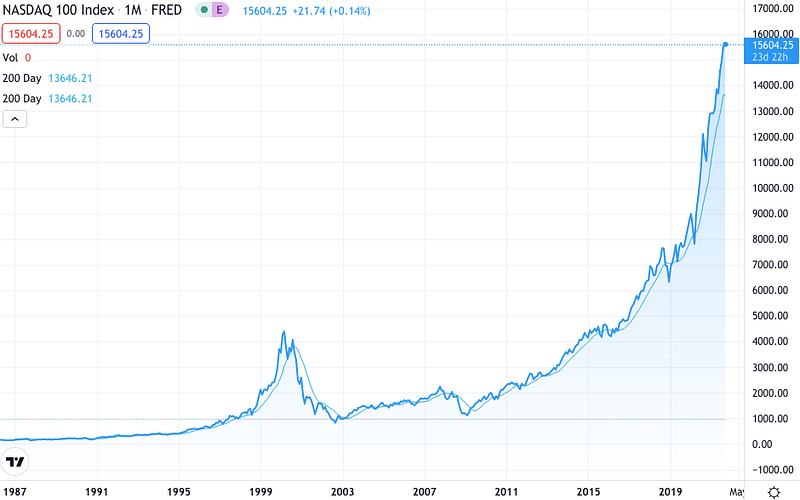
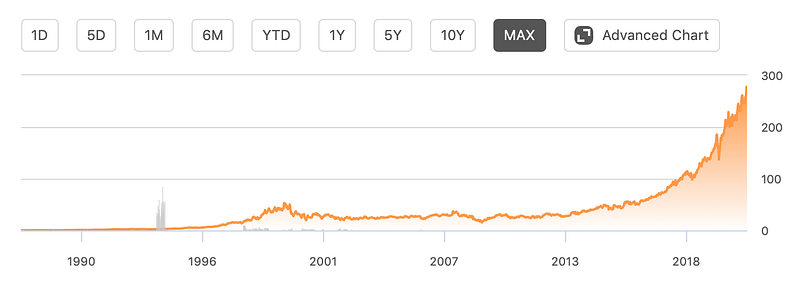
The chart above shows the performance of the Nasdaq from 1987 to today. The dot-com bubble of the late 90s is clearly visible. It truly doesn't take a rocket scientist to realize that the chart of the dot-com bubble and our current bubble are LITERALLY identical in shape. The chart clearly indicates that we are near the end of the cycle, with returns accelerating rapidly over the past two years. The current rate of increase is simply not sustainable.
On a more qualitative level, here are a few key indicators signaling that we are in a bubble:
- Shiller P/E Ratio
- Margin Debt
- Rampant Speculation
- Everyone’s an “Investor”
- Record Capital Inflow Into Equity Markets
- Rapid P/S Multiple Expansion of Tech Stocks
- Companies Priced Beyond Perfection (Valuations detached from fundamentals)
- Manipulated Market (Quantitative easing & stimulus)
- Minimal Market Breadth and High Dispersion
- Explosive Real Estate Price Appreciation
Shiller P/E Ratio
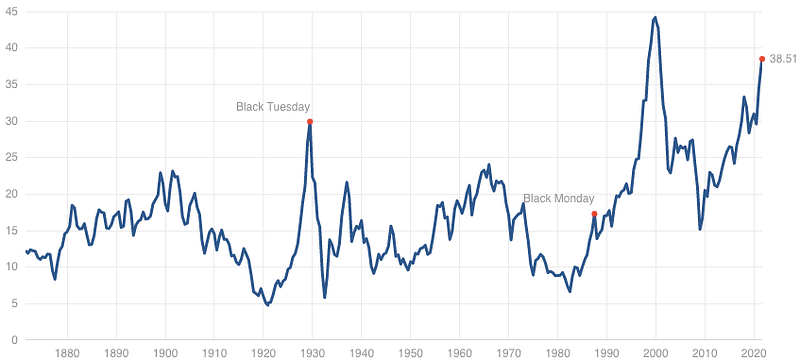
The Shiller P/E Ratio is the price of the S&P 500 divided by inflation-adjusted 10-year averaged earnings. It has reached its second-highest level in history, just slightly below the dot-com bubble.
Margin Debt
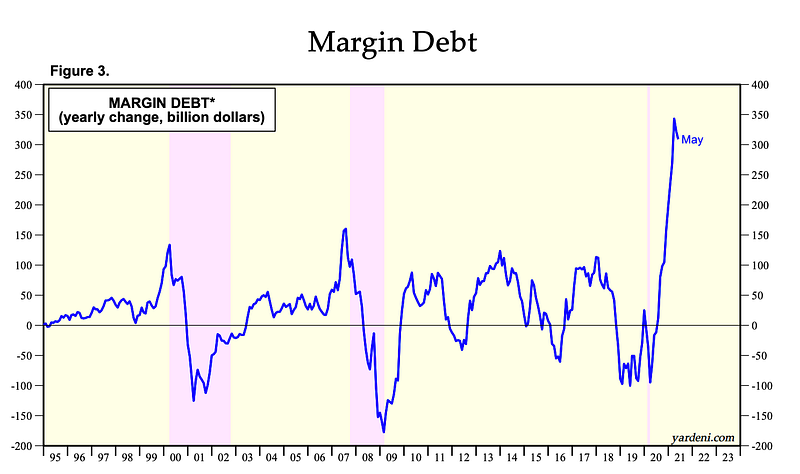
High margin debt signifies that investors are overleveraged. It also correlates to large amounts of speculation and will amplify any downturn. Margin debt has reached a new all-time high, well above the levels seen during both the dot-com bubble and the Great Recession. The yearly percent increase in margin debt now rivals that of both the dot-com bubble and the Great Recession.
The implosion of Archegos Capital is a clear indicator that institutional investors, not just individual speculators, are overleveraged. Arcehgos used over 500% leverage and ended up with losses in excess of $110 billion. I’m almost certain they aren’t the only fund utilizing such extreme leverage.
Rampant Speculation
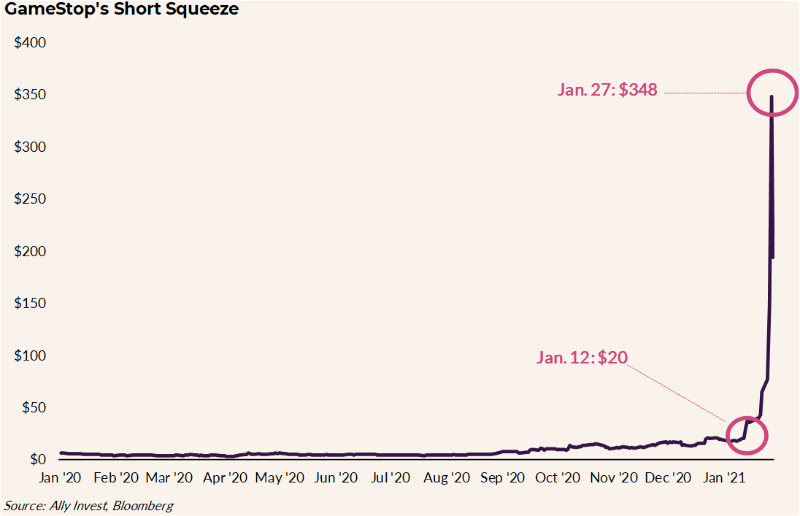
Over the past year, numerous stocks have skyrocketed in short squeezes. When these short squeezes occur, fundamentals become insignificant. Among the most notable is, of course, Gamestop, whose chart is shown above. This tells us about the mindset of a sizable portion of investors: get rich quickly. Alongside these short squeezes have been the implosion of even more hedge funds such as Melvin Capital.
Everyone’s an Investor

According to a Betterment survey, 46% of individuals who received a stimulus check invested it in the stock market. While this survey may have only used a few thousand people, it gives an idea of how much money is flowing into the markets (potentially hundreds of billions of dollars). It is known that a sizable portion of the stimulus has ended up in the hands of young, inexperienced individuals. This likely explains the abrupt rise in speculative trading and irrational exuberance.
Deutsche Bank estimates that the March 2021 stimulus ALONE may have pumped around $170 billion into the stock market. They also noted that the surge in amateur investing (likely caused by stimulus) has been a key factor in driving the equity market rally.
A Goldman Sachs report revealed that small investors have historically accounted for roughly a tenth of trading activity in the stock market but now account for roughly a fourth. With travel halted, restaurants shut, and normal activity at a near standstill for a significant amount of 2020 and 2021, the stock market got a big cut of the money intended to restart the economy.
Here’s a legendary quote from American businessman Joseph P. Kennedy:
“If shoe shine boys are giving stock tips, then it’s time to get out of the market”
The modern-day shoeshine boys are Uber drivers, waiters, and retail employees who all seem to be participating in the rally. Investors are currently greedy, so it’s time to be fearful.
Record Capital Inflow Into Equity Markets
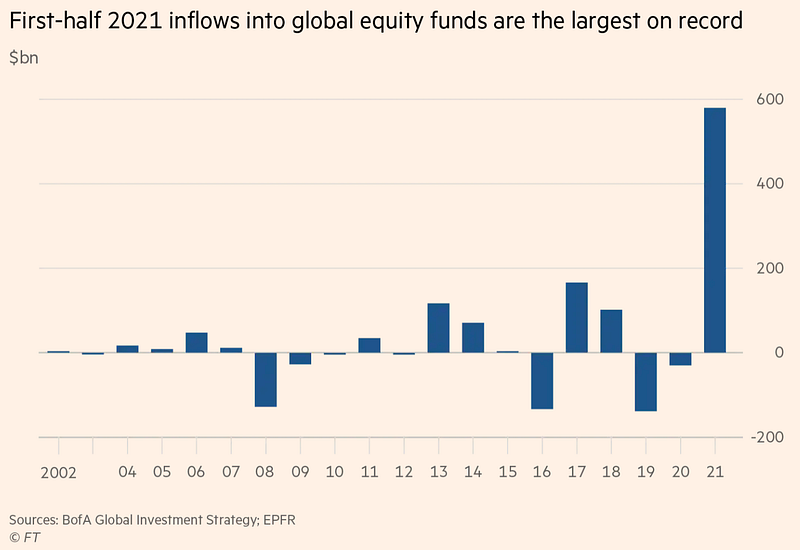
Inflows into global equity funds in just the first half of 2021 were more than 3 TIMES larger than any other year in history.
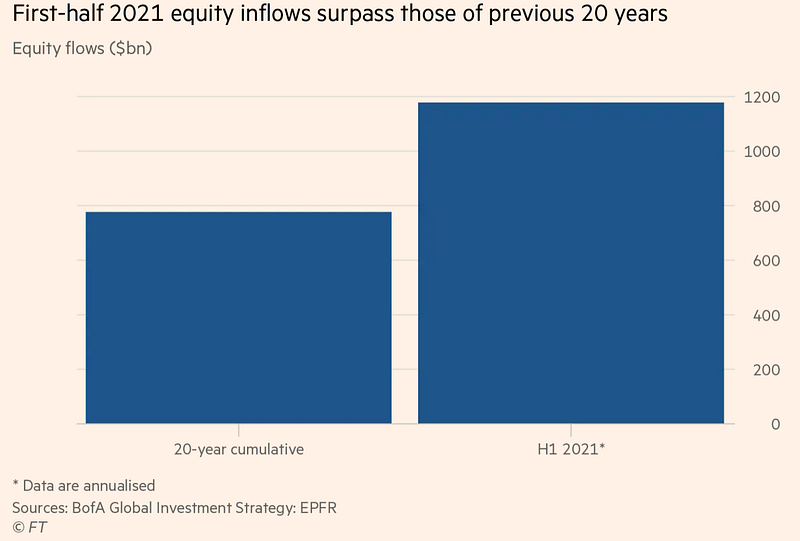
This chart speaks for itself. Pure absurdity. Stimulus, FOMO, and irrational exuberance have resulted in MASSIVE inflows.
Rapid P/S Multiple Expansion of Tech Stocks
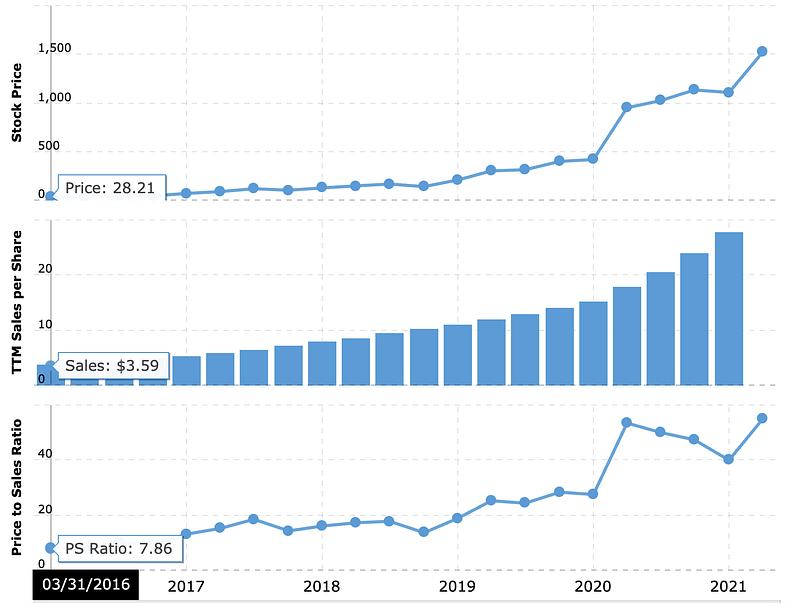
Shown above are some stats of e-commerce giant Shopify. While Shopify has shown superb revenue growth, this does not justify the expansion of its P/S ratio from below 8 to well over 50 in five years.
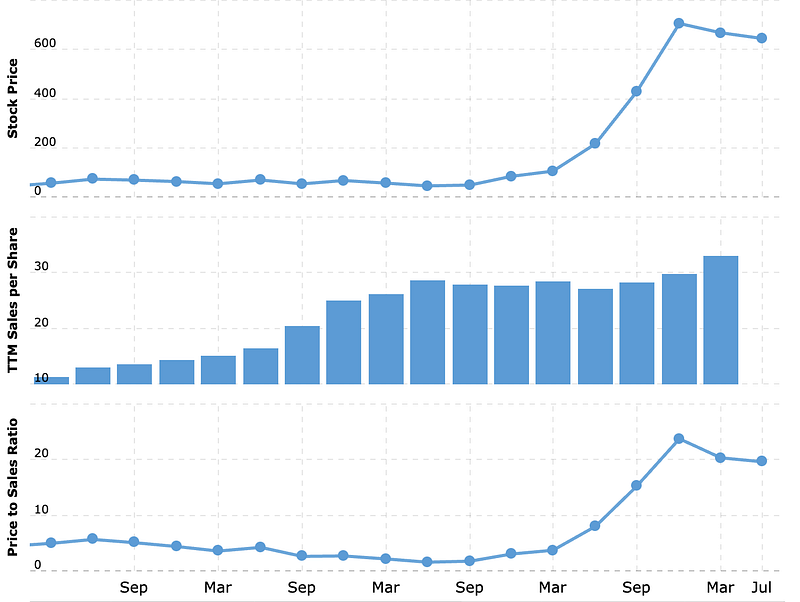
Tesla’s P/S ratio exploded from roughly 1 a few years ago to more than 20. The bizarre part is that Tesla stock rallied when Covid hit even though they didn’t benefit from it in any meaningful way. Nothing fundamentally changed in Tesla’s business to warrant such extraordinary share price appreciation. It was pure speculation and is now widely considered to be the largest gamma squeeze in history.
Companies Priced Beyond Perfection
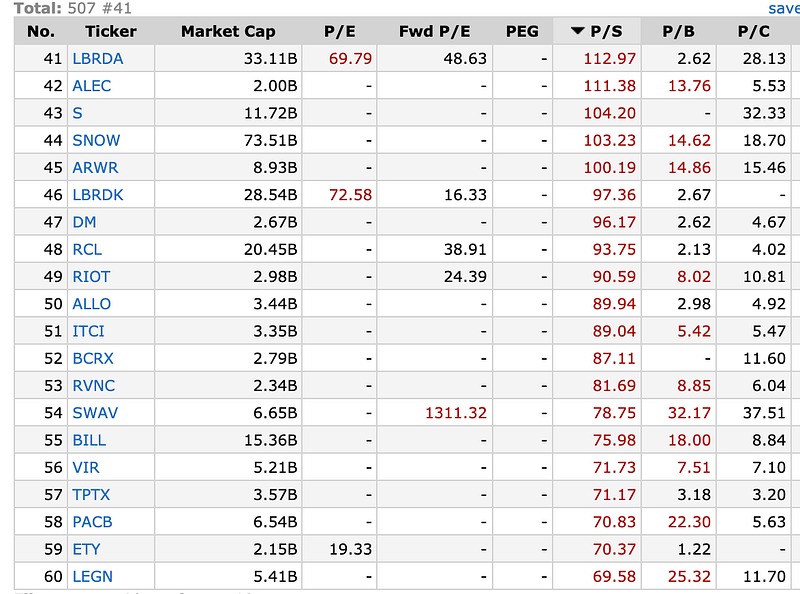
There are currently over 150 companies with a market cap of at least $2 billion (mid-cap) and a P/S ratio greater than 30. There are also over 55 large-cap companies with P/S greater than 30. For perspective, there were only 22 in 1999.
A stock with a p/s above 30 has historically underperformed as an investment. For instance, Microsoft had a p/s of 28 in 1999 and took 17 years to recover. This has created an asymmetric market, with minimal upside and substantial downside.
Manipulated Market
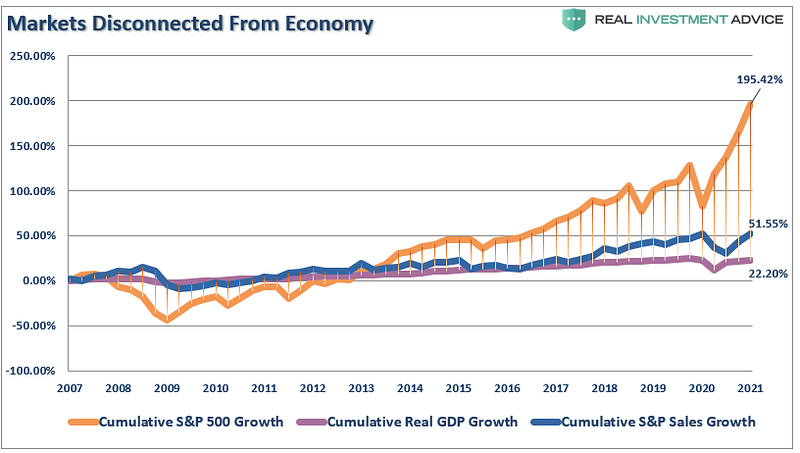
Quantitative easing is the purchase of government bonds or other financial assets such as Mortgage-backed-securities in order to artificially boost economic activity. The Fed began quantitative easing during the 08' recession. Since then, they have pumped roughly $8.2 trillion dollars into treasuries and mortgage-backed securities. The Fed has pledged to inject $120 billion into bonds and MBS each month. This has artificially inflated bonds, which are currently near all-time highs, and makes stocks look relatively “cheap”. As the price of bonds increases, their interest rate decreases. Buying government bonds right now will yield a net negative return since the interest rate on 10-year treasuries sits around 1.519% and inflation is likely between 5–10%. Thus, investors are left with no safe option to preserve/grow their wealth and are either forced to succumb to a net loss or find an alternative. Unsurprisingly, the main alternative has been buying stocks, leading to a profound disconnect from the underlying economy.
Minimal Market Breadth and High Dispersion
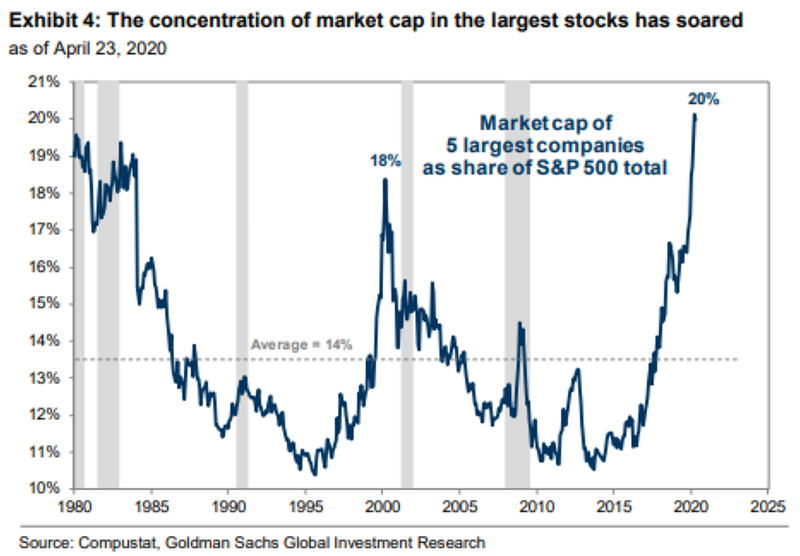
The five largest companies now account for over 20% of the S&P 500 market cap. This percentage is greater than during the dot-com bubble, indicating that investors are piling into mega-caps for “safety”. According to Goldman Sachs, “Historically, sharply narrowing breadth has signaled below-average one month, 3 month, 6 month S&P 500 returns as well as larger than average prospective drawdowns.” While many of the largest S&P 500 and Nasdaq stocks are near all-time highs, the average stock is well below its all-time high. This may be a signal that the market has already peaked.
Real Estate Prices are Exploding
Below are some of the most substantial bubbles:
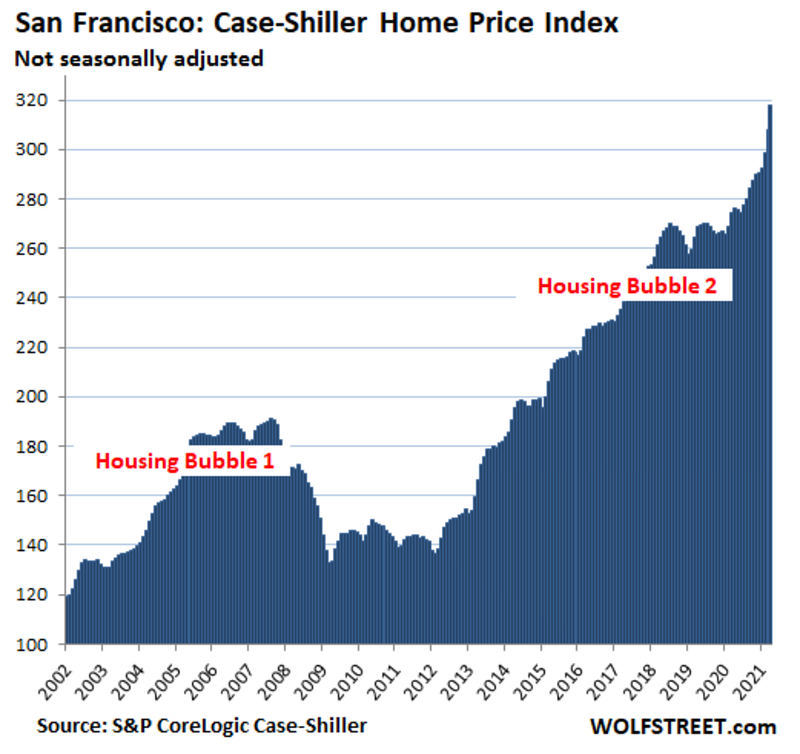
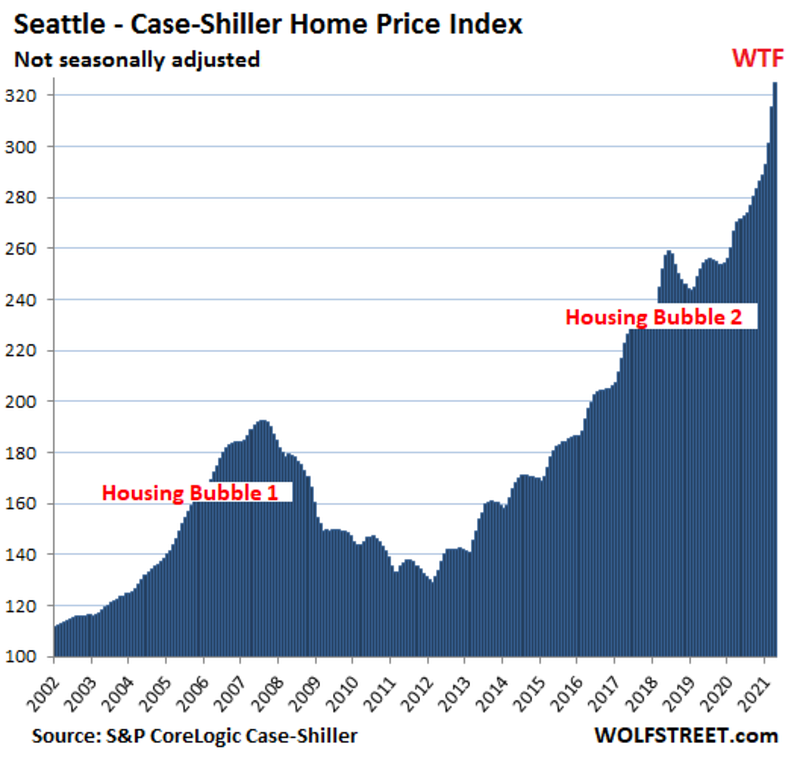
The charts above vividly indicate that the real estate price appreciation over the past few years has been on par with that of the years prior to 08'. It’s also pretty easy to tell that the market is nearing a top based on how steep the increase has become. Low mortgage rates as a result of quantitative easing combined with skyrocketing stock portfolios and FOMO have resulted in excessive demand for homes. Once the Fed begins tapering (injecting less and less money into bonds and MBS every month), mortgage rates will rise and home prices will stagnate or fall. Additionally, if the stock market starts to crash, fewer individuals will have the money to buy a home and the euphoria will disappear (ripple effect).
Additional Thoughts
Many of the eviction moratoriums have recently ended, meaning housing and rental supply will increase. The student loan moratorium ends on January 31, 2022. Students will be forced to cut back on their spending in order to pay their loans. This means less money will flow through both the equity markets and the overall economy. A slight decrease in market speculation may follow.
The Fed recently announced that they are ready to begin tapering, meaning it is anticipated to begin by the end of the year. As mentioned above, this will result in increased mortgage rates/fewer home buyers as well as higher interest rates in general.
House Democrats have proposed a 26.5% corporate tax rate, which is significantly higher than the current 21% rate imposed by President Trump. A sharp increase in the corporate tax rate will eat into corporate profits and weaken earnings reports at a time when perfection is a necessity.
How to Hedge, or Even Profit From the Implosion
I am confident the bubble will burst within the next year, although it could happen way sooner. It’s virtually impossible to pinpoint what the catalyst will be, but something’s got to give. With that said, here are some ways to prepare and potentially profit from the collapse.
Prepare:
- Start hoarding cash
- Liquidate a significant portion of your investment portfolio and sell high flying tech stocks (have at least 10% cash)
- Research companies you may purchase during a downturn
Profit:
- Short high-flying tech stocks
- Short Ark ETFs (full of bubbly, overvalued nonsense)(most heavily shorted ETF in the entire market)
- Buy LEAPS (Long-Term Equity Anticipation Securities) puts on tech stocks
- Buy puts on the TLT (20 year Treasury Bond ETF)
Best of luck to everyone!
Disclaimer: The ideas mentioned above are not financial advice and are highly speculative.