
The #Election2016 Micro-Propaganda Machine
😱Real Sources / Fake News
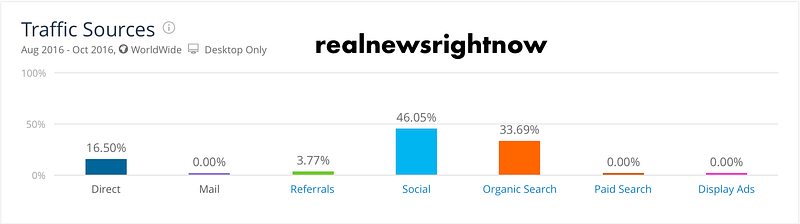
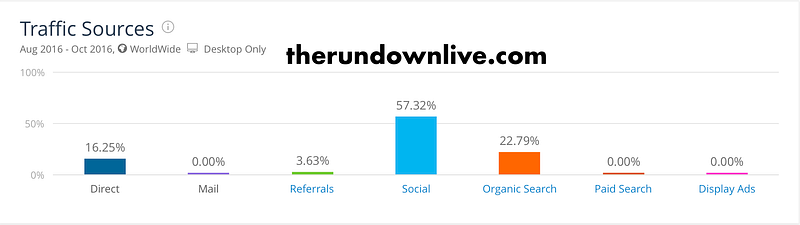
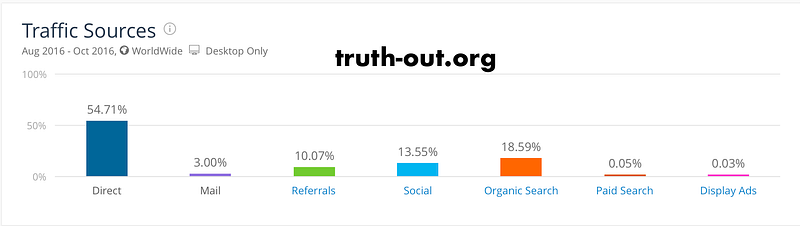
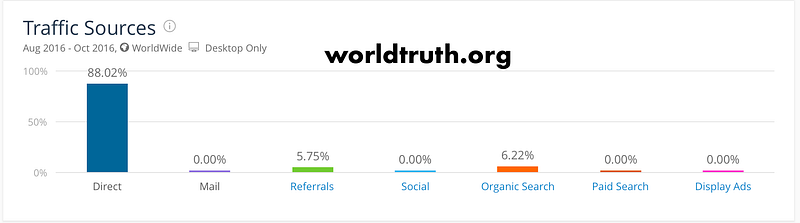
After finding evidence that much of the “fake” and hyper-biased news traffic during 🇺🇸#Election2016 was arriving through direct hyperlinks, search engines, and “old school” sharing tactics such as email newsletters, RSS, and instant messaging, I thought I would do a small “big data” project.
I wrote this piece because I feel the argument about Facebook’s role in influencing the outcome of the U.S. election doesn’t address the real problem: the sources of the fake/misleading/hyper-biased information. Sure, Google’s ad network and Facebook’s News Feed/“Related Stories” algorithms amplify the emotional spread of misinformation, and social media naturally turn up the volume of political outrage. At the same time, I think journalists, researchers and data geeks should first look into the factors that are actually 1) producing the content and 2) driving the online traffic.
Rather than analyze “known unknowns” with incomplete metrics and partial analytics (i.e., measuring the famously opaque Facebook engagement metrics), this analysis looks directly at the source.
⚗Welcome to the Micro-Propaganda Machine
There’s a vast network of dubious “news” sites. Most are simple in design, and many appear to be made from the same web templates. These sites have created an ecosystem of real-time propaganda: they include viral hoax engines that can instantly shape public opinion through mass “reaction” to serious political topics and news events. This network is triggered on-demand to spread false, hyper-biased, and politically-loaded information.
For this analysis, I’m calling it “fake news.”
It’s what I term the #MPM: the “micro-propaganda machine” — an influence network that can tailor people’s opinions, emotional reactions, and create “viral” sharing (😆LOL/haha/😡RAGE) episodes around what should be serious or contemplative issues. The increasing influence of this type of behavioral micro-targeting and emotional manipulation — data-driven “psyops” — has become more noticable as people begin to reflect on the outcome of the recent #Brexit and U.S. election.
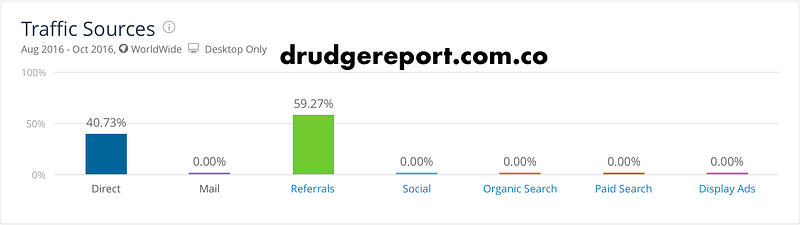
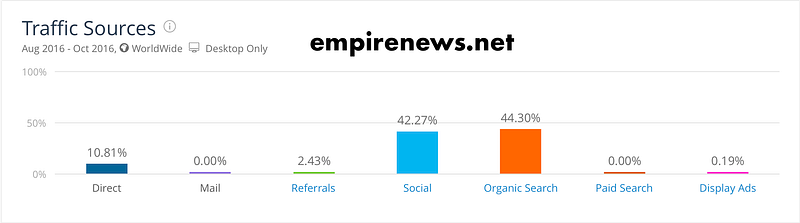
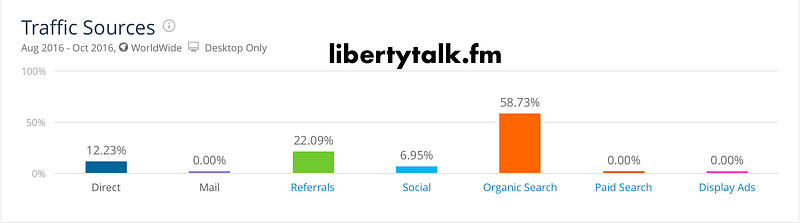
In my previous post, I found that only ~60% of incoming traffic from a sample of leading “fake” and hyper-biased news sites seemed to be coming out of Facebook and Twitter. The remaining ~40% of web traffic was organic — coming from direct website visits, P2P shares, text/instant messaging, subscription e-newsletters, RSS, and search engines. Again: Less than 0.1% of the traffic to the sites I looked at came from display advertising or (known) paid search content.
My guess was that this network — the #MPM — of small “fake” and hyper-biased sites has been pushing traffic through links — and helping to inject this content into platforms like Facebook and Twitter. This effort was likely ramped up around the time the 🇺🇸#Election2016 primaries concluded, as well as any time a new political issue (involving email servers, groin grabbing, immigrants, etc.) takes place.
The data in my last piece showed mail.google.com (📧Gmail) being one of the top “upstream” sources of traffic coming into Infowars.com, an influential player in the right-wing news sphere. For this project, I did a medium-scale data analysis — crawling and indexing 117 websites that are known to be associated with the propagation of fake news content and the spread of what I’m calling “hyper-biased” propaganda.
For the purposes of looking directly at what some have termed the “alt-right” political propaganda machine, I kept the sources in this analysis restricted to sites that have been 🗯⚠️publicly called out by internet users and listed by editors on the following verification sites: Snopes, Fake News Watch, Real or Satire, and Media Bias Fact Check.
Due to the sensitivity of this type of research, I feel complete transparency is key: Below is my list of the 117 sites I scraped and indexed in my #MCM election data project.
I crawled 🕷 every website on the list and extracted URLs one “level” deep. This scraping effort, given the relatively basic structure of these template-based websites, represents the majority of links on these sites (735,263 of them, to be exact).
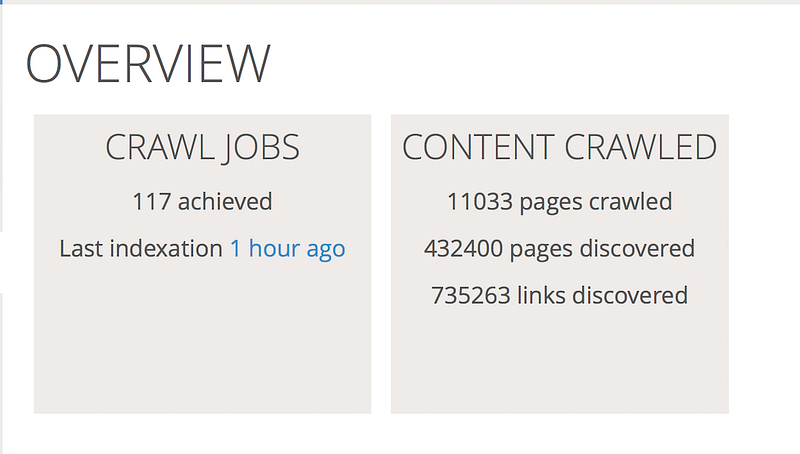
🔂After a couple of hours, my scraping/indexing effort resulted more than 11,033 webpages, and 735,263 hyperlinks. Out of this data set, there were 80,587 hyperlink connections —aka shared URLS — across the 117 fake news websites.
Where does the #MPM point? What does it look like?
I looked for patterns in the shared links to find what places these fake news websites seem to be linking to, as well as their most common inbound link destinations, and the structure of how the #MCM was embedded across the wider 🇺🇸#Election2016 mediascape.
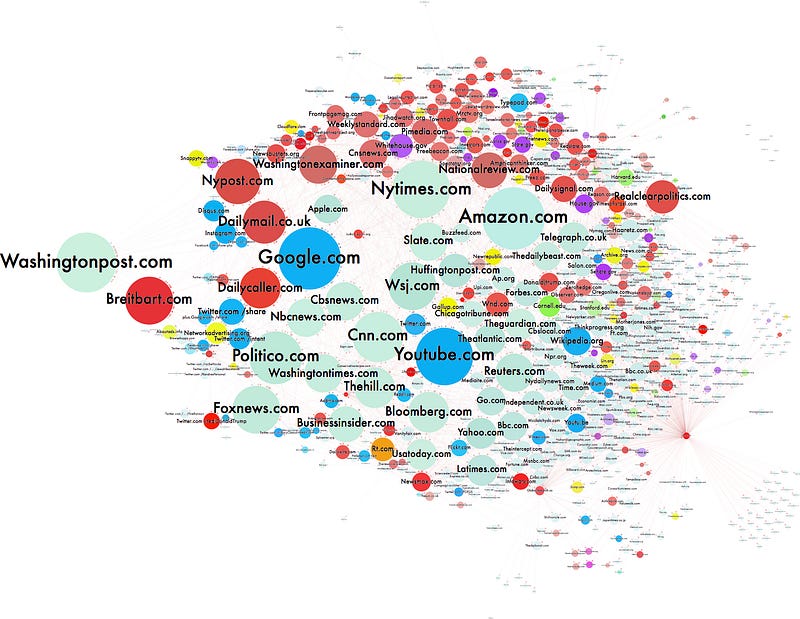
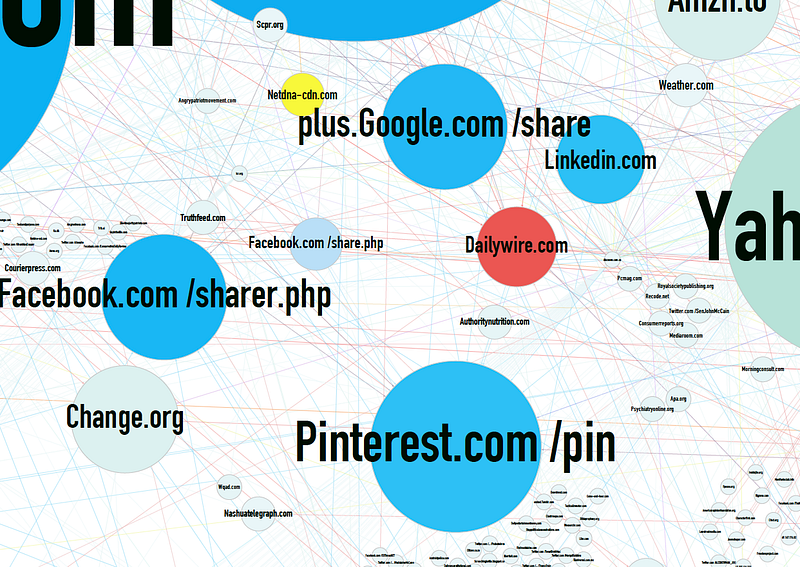
{After exporting the dataset (.gexf file), I sorted out the news “network” at the widest scale using an open source tool, GEPHI, and the ForceAtlas2 algorithm. Any website with at least two shared URLs (links) to them from the 117 sites on my list above appear in my #MPM network graph. There were just over 2000 sites in the network, and all data obtained was publicly available and appeared on the websites as of 17-Nov-2016}
Legend
The circle, or “node,” size on the following graph(s) is proportional (1–100 scale) to the number of shared hyperlinks that link into the site from the 117 website sample. The colors are sorted according to actor type.
Red=🔴right-wing media; Purple=⚛government entities; Yellow=🤔interesting things; Blue=🔵social media; Green=✳️education; and the less prominent nodes were left gray.
#ICYMI
The following website data map, called a network graph, can be used reflect on #Election2016. It can help us discover:
- The 🔝 influential sites that are central to information flow in the micro-propaganda network. From a social influence perspective, this data helps us find which sites drive conspiracy/misinformation/“fake” and “viral” content/propaganda online, and see how each is positioned on the internet and;
- 🔎Where and ⚗how this micro-propaganda machine tends to coordinate its resources. By displaying network-level patterns in how these sites are linked to one another, and showing how dense their connections (“edges”) are, we can visualize how this propaganda network is positioned “around” other actors, such as the “lamestream media” and “mainstream” social media platforms.
{What this data cannot show — at least, directly — is why these links exist or exactly when they were established. To put it simply, this map can show us the frequency and direction of “fake news” relationships, but can’t display the complete nature of the connections.}
Can Data Be Richer Than Trump?
This originally small project turned out to be an unexpectedly rich data capture — I could probably write about it for weeks. However, there are several fascinating themes that are displayed in this fringe-right propaganda network (see embed above for high resolution version). I’m publishing this now, since I feel it can help solve the #Election2016 equation.
🏹1. The Targets: Mainstream Media, Social Networks — and Wikipedia
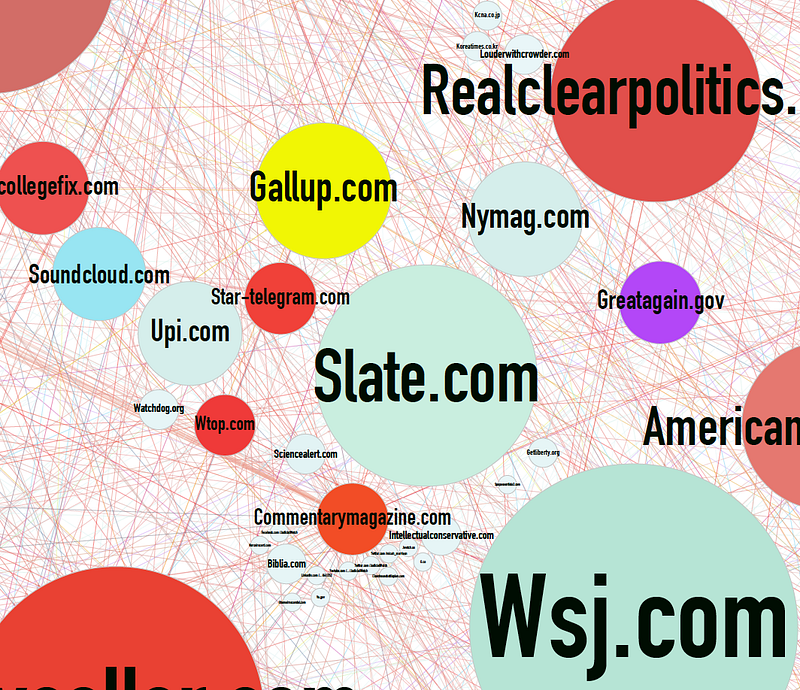
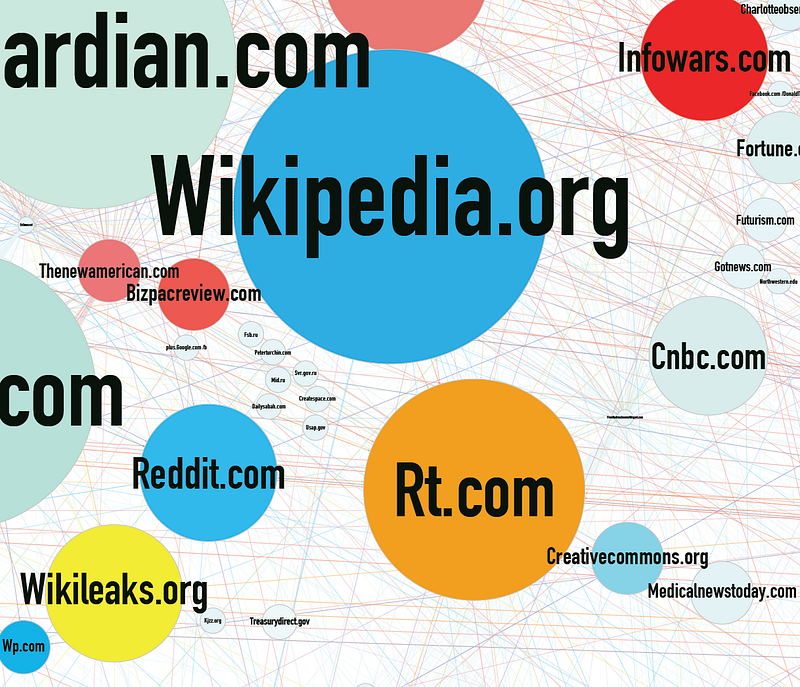
First, as my previous post noted, the sites with the most inbound hyperlinks (the largest circles on the graph) in this fake news propaganda network are Google, YouTube, the NYTimes.com, Wikipedia, and strangely, Amazon.com. The larger the circle, the more links are coming in from the 117 #MCM network sites.
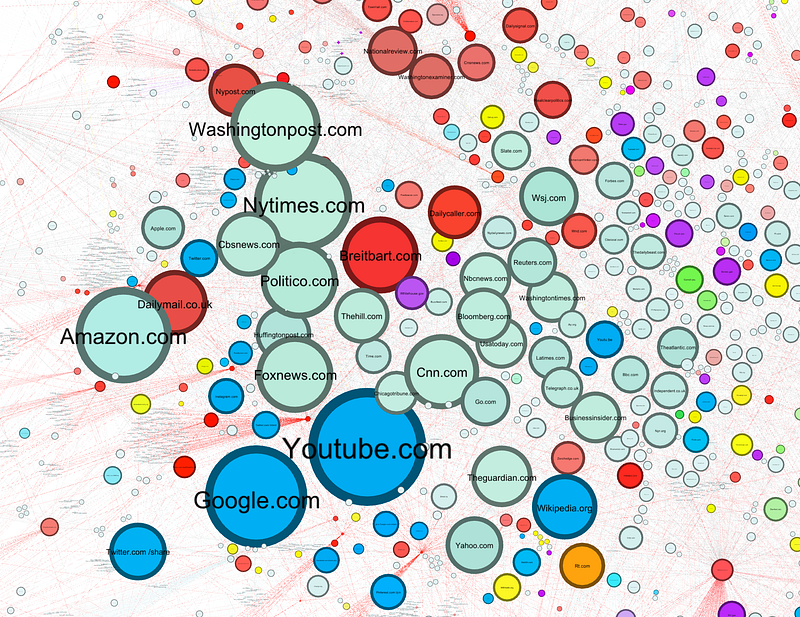
YouTube’s dominance was expected, as many sites — “left-wing,” “right-wing,” or otherwise —post links to videos, creator channels and documentary-style “educational” material. Again, the 🌀LARGEST circles are the domains that are linked to the MOST by the propaganda engine. I’ll come back to the separate “webpages” at the end — there’s a countdown of the “top ten” individual links.
🛰2. Mainstream Media Are Mostly “Surrounded”
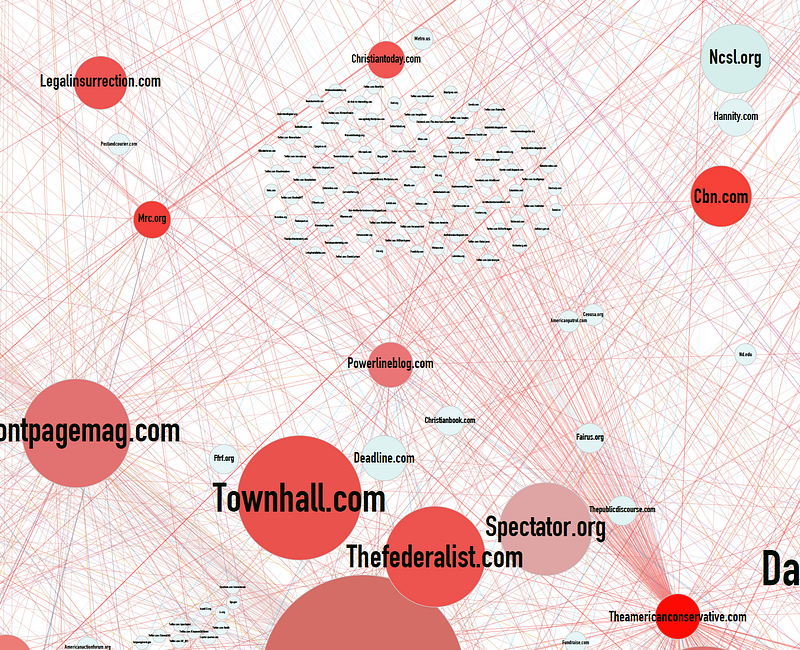
You can see on the “zoomed out” graph (image below) the #MPM — i.e., ID’d right-wing, fake news, conspiracy, anti-science, hoax, pseudoscience, and right-leaning misinformation sites — in 🔴red.
If you look at the graph closely, you’ll see they basically surround most of the mainstream media, including the largest 🎨“liberal” media, on the network. This includes national newspapers like the New York Times, The Washington Post, and even “right-wing” media such as Breitbart.com, the Dailycaller.com, and the National Review.
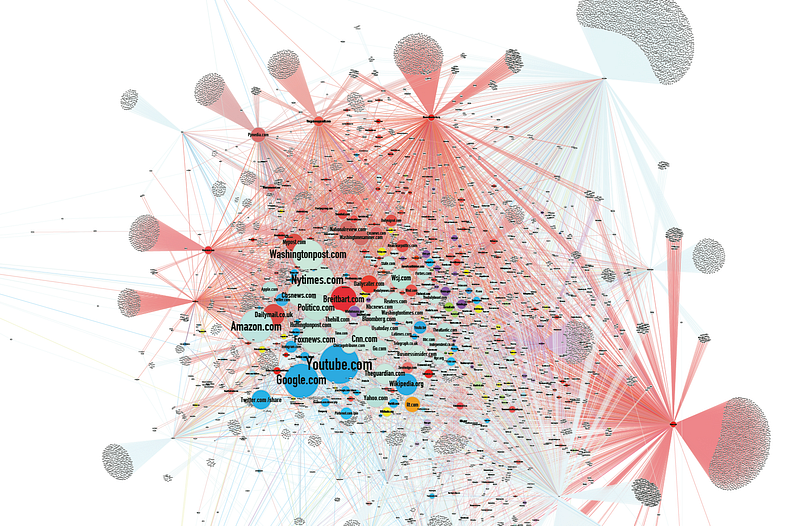
The sites in the fake news and hyper-biased #MCM network have a very small “node” size — this means they are linking out heavily to mainstream media, social networks, and informational resources (most of which are in the “center” of the network), but not many sites in their peer group are sending links back.
The most influential sites line the 🌐periphery of the virtual propaganda network. You can see (image above) that many of the sites have a large flood of red hyperlinks flowing outward — some of these are in the thousands. For the purposes of this analysis, the red lines (each representing a different URL) “matter” most when they are headed towards the large nodes in the center of the network.
🎥3. Content Sharing and Media Hosting
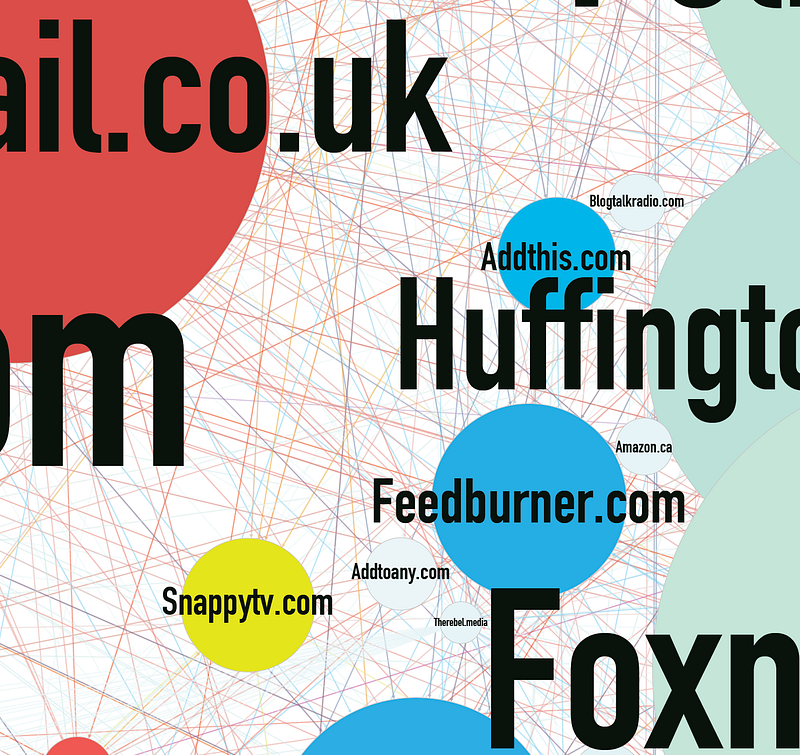
The #MCM network displays a high number of links to content creation and web asset-hosting services (Wordpress.com, Statcounter.com, WP.com, etc.). These likely are shared to help the website users produce content and measure the impact of their audiences. The zoomed-in views (see images below) also suggest that these fake news sites use social platforms to share as well as coordinate through hyperlinks:
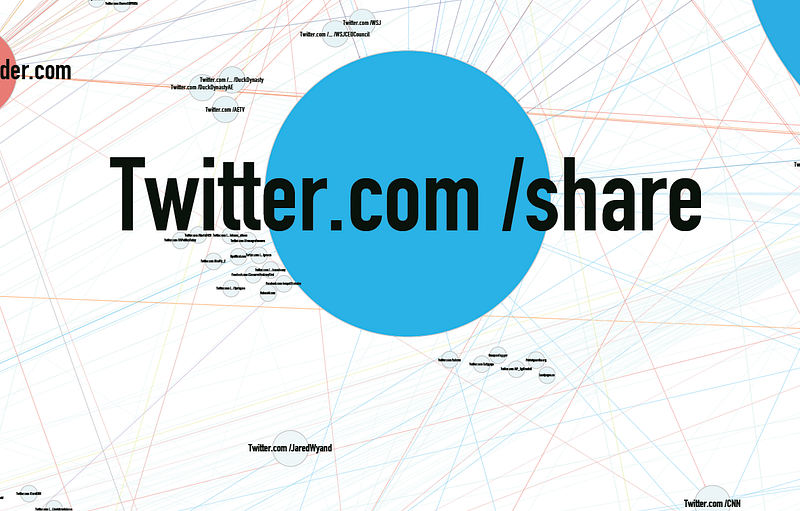
I’ll explain: If you look around the largest picture of the network (see first image), you can see the 🤖🤖🤖 coordinating effect of individual page hyperlinks. In the next image, you can see how many larger red nodes have smaller “interest clusters” — these appear to consist primarily of Twitter accounts, public Facebook pages, and other miscellaneous issue-based websites:
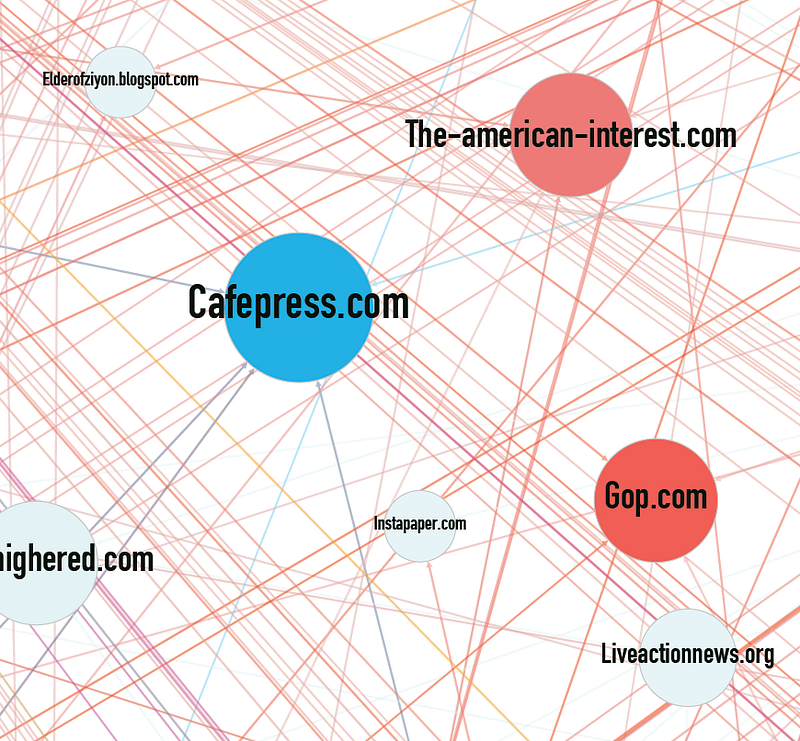
🎛4. Material and Digital Production Tools and eCommerce
In the next images (see below), there are an interesting number of links pointing to 👕consumer goods/commerce sites and ✂️digital production tools. These include CafePress (t-shirts), Feedburner (RSS news), and Addthis.com (social sharing scripts).
This could mean that the propaganda network may be use these resources internally to spread — as well as generate some income — off of politically-themed news events and political debates. These links might be pushed into other locations on the internet, especially social platforms like Facebook and Twitter. Oddly, Amazon.com (see first graph, above) is also a top inbound link destination in the #MCM network. Further analysis is needed to uncover the type of content/resources all of these links point towards.
✅5. Fact Checking and Knowledge Editing
Next, the #MCM network links heavily to a major poll site, Gallup, and crowdsourced fact-checking and reference resources —most notably Wikipedia, Reddit, and Wikimedia. Snopes and other fake news verification sites are in the “liberal” side of the network at the top-middle right (see the first large graph).
The Four Corners of the #MSM
This is a preliminary data analysis, but beyond the specifics — like all network graphs — I feel the the widest picture of the network (again, the first full-size network graph) is intriguing. The network is clearly split into several ideological regions: The ⬅️far left and ↖️top left areas have the most “alt right” and “hard right” actors; the ⏫middle top region shows a strong religious base as well as a strong anti-Islamic component.
The ➡️far right side seems to be most 🎨“liberal,” and this side adds increasing numbers of governmental actors as it joins the harder-right religious conservative actors around the 🔼mid-to-upper center of the network. The ↙️bottom left region is primarily influential social media accounts, and the ↕️bottom center involves many international media outlets; similar to the upper half of the network, the lower half starts to pick up more university websites, environmental action and policy sites, and tech-oriented actors (e.g., EFF.com) as you move towards the ↘️bottom right.
The unofficial top ten #MCM link countdown
To wrap up this post, I’m listing the most-shared non-domain links in the “micro-propaganda machine” network. This means the most commonly shared links (i.e., InDegree) out of the 80,587 URLs that link to individual pages (i.e., not the NYT front page, Facebook.com, Google email/searches).
⚡️The top 10 #MCM #Election2016 URL destinations:
📚Bonus: The large Amazon.com inbound link presence in the network appears to be through the fake news sites’ Amazon seller affiliate links. These links are for getting kickbacks on merchandise sold (books, magazines, etc.) from ads on their site, or through Amazon recommendations in original posts or book recommendations.
I translated the top individual Amazon.com link in the network through an affiliate code-matching website. It’s a subscription (through Amazon) to a conservative magazine:
This is just a 🔭glimpse of publicly available data related to the election. This post has a fair portion of what I found, but I do hope to look into the data more. I also plan to look at the exact opposite bias — meaning switching this network graph around and coding the “left-wing” websites to see what sorts of linking patterns play into 🎨liberal micro-propaganda from the recent election.
I hope this glimpse into a set of focused medium data offers another path to move forward, since I see little point in arguing about complex, ever-changing 🔢algorithms.
I also believe that platform-specific social network metrics are often more trouble than they are worth. For one, we don’t know how these proprietary measurement systems work for a reason: they involve💰multibillion-dollar business models and 🔐confidential IP. While Facebook’s engagement metrics are interesting to think about, they don’t really offer us much in the way of pinpointing the propaganda, misinformation, and viral/hoax clickbait that really shaped the election.
What does 📈“engagement” really mean? What does it drive? As Craig Silverman correctly stated at the end of his recent Buzzfeed “fake news” analysis, we don’t really know for sure:
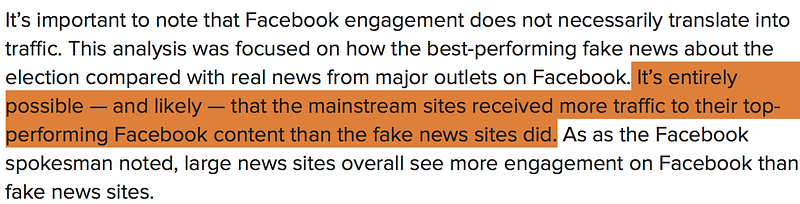
I’ve tried to be 📝transparent in this analysis. I do expect to take some heat for the selective focus, which involves previously uncharted political data-journalistic waters. But I feel at this point ALL research involving fake news is a move in the right direction.
As I recently argued, turning around and blaming Facebook, Twitter, and Google for our 🌍 widespread social and cultural problems isn’t the best place to start. I mean, why look at the result when you can look at the 🎯 problem? That’s exactly what I’ve tried to do here.
🔬💼 Part II of this “fake news” research project ⤵️:


