
The easiest way to build GUI’s with Python
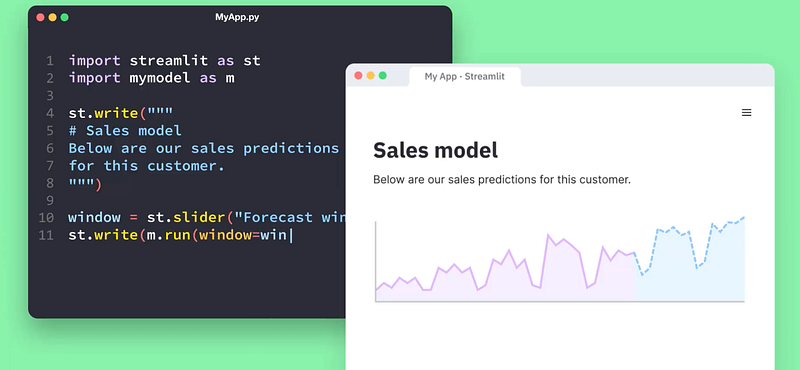
Welcome back! Python is an awesome language to develop front-end software / GUI’s, I love being able to develop out both the back-end and front-end with one programming language. Although GUI development isn’t easy, there are packages out there that allow us to build out front end software easier than others, I’ve personally used packages like TkInter and PyQT but found they maybe a bit difficult to get started, so let’s take a look at another package that i’ve used heavily: Streamlit. This specific front-end package allows us to build out fairly modern UI’s in very little time, i’ve built out several data applications only with this specific package, take a look at a few of the examples of the capability of Streamlit:
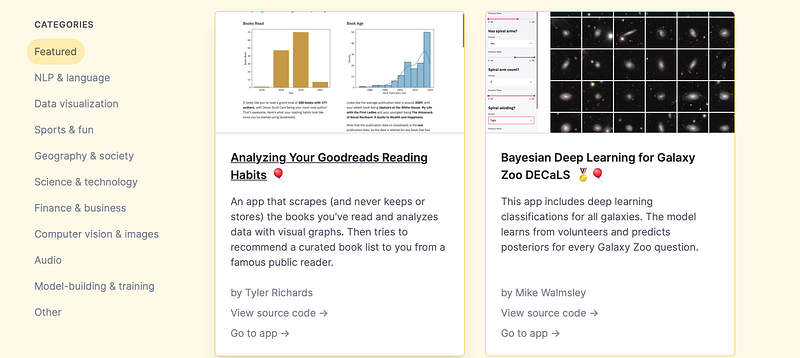
If you would like, take a look at the examples below:
Now, let’s go ahead and build out a sample GUI, I wrote out an article that goes into exact detail on how to do this, check it out below:
I’ll go ahead and go through a high level overview covered in that article.
Installation
First off, we will need to install Streamlit, in order to do so we can use pip install, if you don’t have pip, read this article I made that shows how to install it. run this following command inside of your terminal / command prompt:
pip install streamlitAwesome, once installed we are ready to go!
Let’s build a GUI!
Before building the GUI, let me break down the process:
First, we build out the app in Python > we then execute the code using streamlits function in our terminal / command prompt > then our web browser will open the streamlit app
To begin, let’s open a blank Python script, streamlit mentions in their beginning tutorial “first_app.py” but you can name it whatever you want, we then want to import the following packages:
import streamlit as st
import numpy as np
import pandas as pd
import time
These are the only packages we need to build a basic GUI for now, next off let’s name our app, we do so with the following line:
st.title('My first app')We can also write out a standard line by using this statement:
st.write("WRITE THE TEXT HERE")Next up, let’s use that knowledge to build out a table with a sentence describing what we’re doing, we do that by using the following lines:
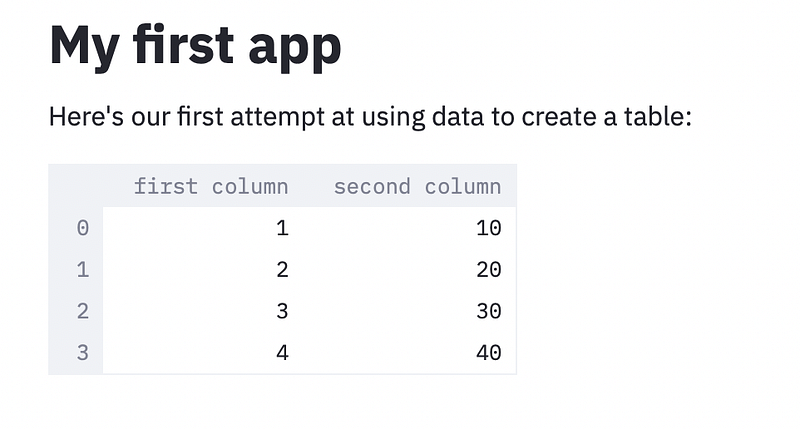
st.write("Here's our first attempt at using data to create a table:")
st.write(pd.DataFrame({
    'first column': [1, 2, 3, 4],
    'second column': [10, 20, 30, 40]
}))
At this point, we have a GUI that looks like this:
Awesome! Streamlit also has a very cool built in function which makes it a bit easier to build out a GUI, this method is called “Magic”. Without using the streamlit commands as mentioned above, the below script will also output the same result as above!
“””
# My first app
Here’s our first attempt at using data to create a table:
“””
df = pd.DataFrame({
‘first column’: [1, 2, 3, 4],
‘second column’: [10, 20, 30, 40]
})
df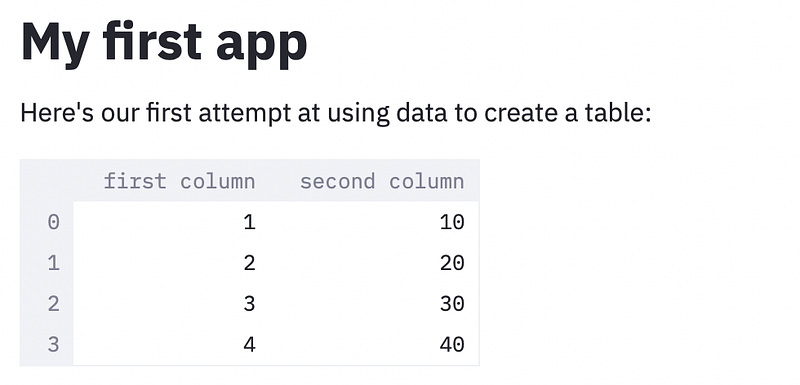
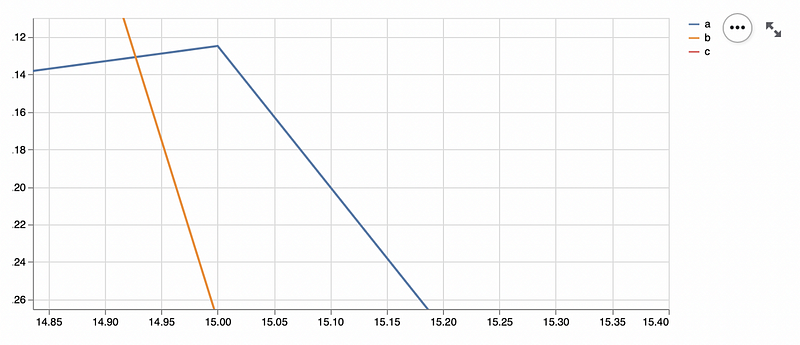
Great! Next up, let’s output our own chart in this GUI, in this example we’re using a dataset of different numbers, but feel free to use your own datasets if needed:
chart_data = pd.DataFrame(
 np.random.randn(20, 3),
columns=[‘a’, ‘b’, ‘c’])st.line_chart(chart_data)This output would essentially be this in the GUI:
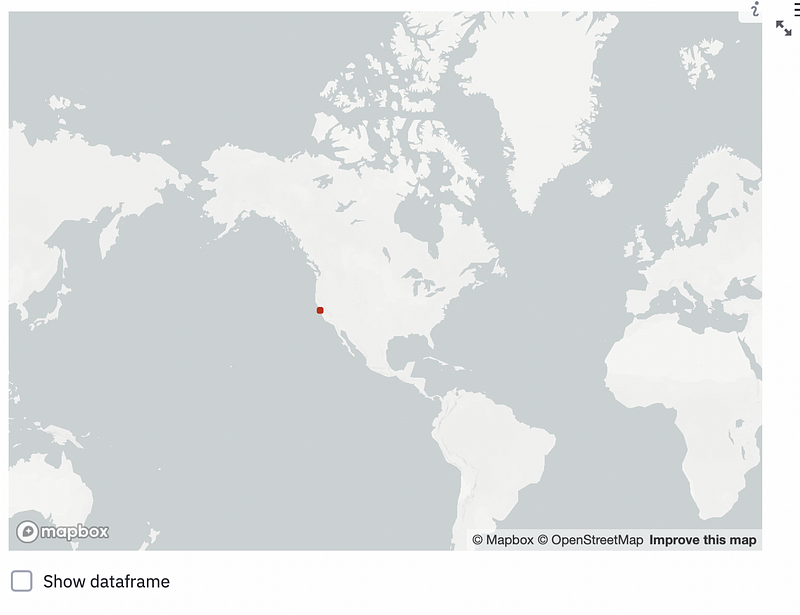
We can also add a map to this specific GUI as well by using the following commands:
map_data = pd.DataFrame(
 np.random.randn(1000, 2) / [50, 50] + [37.76, -122.4],
columns=[‘lat’, ‘lon’])st.map(map_data)The output would be this:
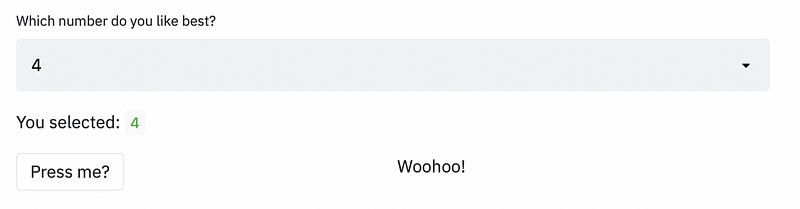
You can probably begin to see how easy it is to pretty much build a web app using stream lit, but there is alot more you can do with this program. You can also add some customizability within your front end, for example, let’s say we wanted to get someones input, we could use the following lines of code to do so:
option = st.sidebar.selectbox(
    'Which number do you like best?',
     df['first column'])
'You selected:', optionleft_column, right_column = st.beta_columns(2)
pressed = left_column.button('Press me?')
if pressed:
right_column.write("Woohoo!")expander = st.beta_expander("FAQ")
expander.write("Here you could put in some really, really long explanations...")This output would essentially be this:
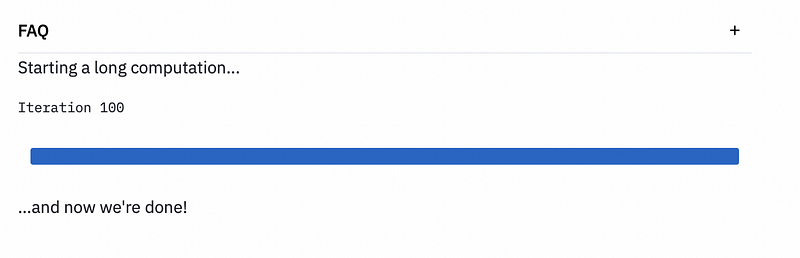
Streamlit also mentions in their tutorial that you can add a progress bar as well into the program, this is how to do so in this example:
‘Starting a long computation…’
# Add a placeholder
latest_iteration = st.empty()
bar = st.progress(0)
for i in range(100):
# Update the progress bar with each iteration.
latest_iteration.text(f’Iteration {i+1}’)
bar.progress(i + 1)
time.sleep(0.1)‘…and now we\’re done!’This essentially prints out this:
Running The Project
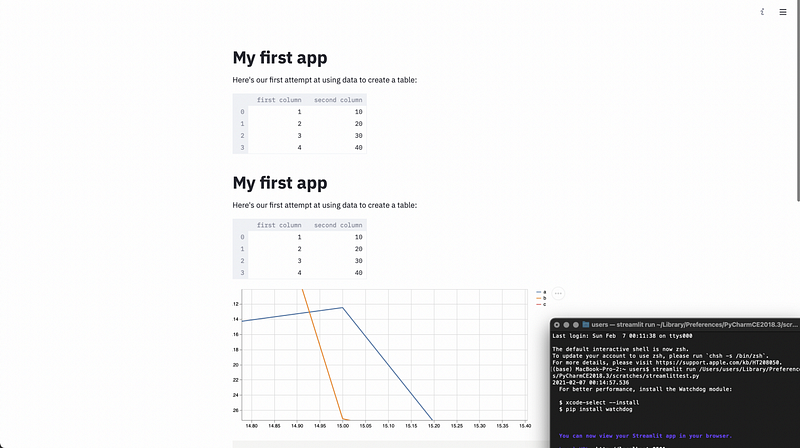
Running a streamlit project is a little bit different than running a standard Python project, we have to run this project using the streamlit command in our terminal / command prompt. To do so, first save your Python file & get the directory of that file. Next, let’s make our way to our terminal / command prompt and use the following streamlit command:
streamlit run DIRECTORY TO YOUR PYTHON FILE/file.pyOnce we run that in our Terminal, we should see our terminal open the streamlit command option and open up a web page in our default web browser, we then will see our web browser get populated with our streamlit code, here is what the finished project should look like:
There you have it! That is essentially how easy it is to build out a GUI using Streamlit, in my opinion this is probably the easiest package for GUI development with Python, do you plan on using Streamlit? I would love to hear your thoughts!
As Always
if you have any suggestions, thoughts or just want to connect, feel free to contact / follow me on Twitter! Also, below is a link to some of my favorite resources for learning programming, Python, R, Data Science, etc.
Thanks so much for reading!