
The Difference Between Mean and Median: Why It Matters in Data Analysis
Let’s begin with clear definitions and examples of both mean and median.
Definitions of Mean and Median
Mean: The mean, often referred to as the average, is calculated by summing all the values in a dataset and dividing the result by the number of values. The formula for calculating the mean is:
Mean= Σx/n
For example, in a dataset containing the values {4, 8, 6, 10, 12}, the mean would be:
Mean= (4+8+6+10+12)/5 = 40/5 = 8
Median: The median is the middle value in an ordered dataset. If the number of data points is odd, the median is the middle value. If the number is even, the median is the average of the two middle values. The process of finding the median involves first arranging the data in ascending order and then identifying the central point.
For the dataset {4, 8, 6, 10, 12}, when arranged in order {4, 6, 8, 10, 12}, the median is 8.
In cases where the dataset contains an even number of values, say {3, 7, 9, 15}, the median would be the average of the two central values (7 and 9), resulting in a median of 8.
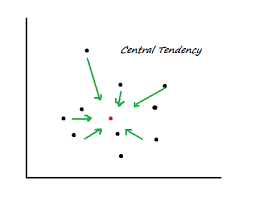
Introduction to Central Tendency
In statistics, central tendency is a fundamental concept that aims to identify the center point or typical value of a dataset. By understanding the central point, we can make sense of a large collection of data and summarize it with a single representative value. Among the measures of central tendency, mean and median are the most common. Each provides insights into the dataset but serves distinct purposes depending on the nature of the data.
The importance of choosing the right measure becomes particularly evident when dealing with real-world datasets, which may contain outliers or skewed distributions. This article delves into the differences between mean and median and explores why these distinctions are critical in data analysis.
Differences in Interpretation
While both mean and median give us insights into the dataset, they can convey different stories, especially when dealing with skewed distributions or outliers.
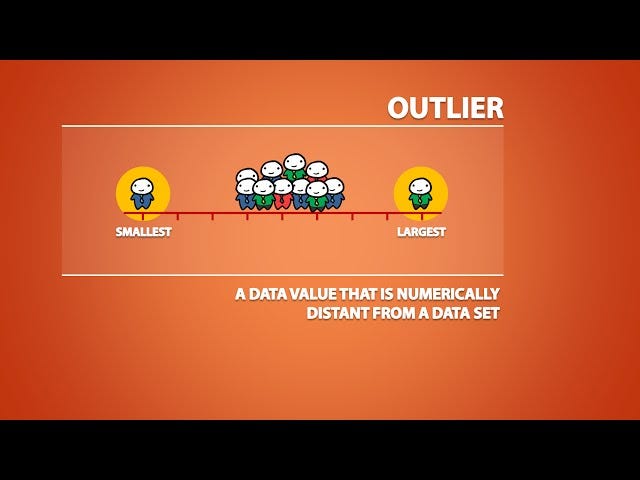
1. Impact of Outliers: The mean is sensitive to outliers. For instance, if you have the dataset {3, 7, 9, 15, 100}, the mean becomes 26.8, a figure skewed by the outlier 100. In contrast, the median remains 9, offering a more representative central value that is less influenced by extreme numbers.
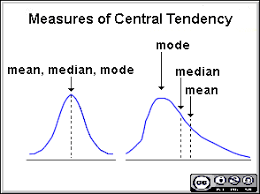
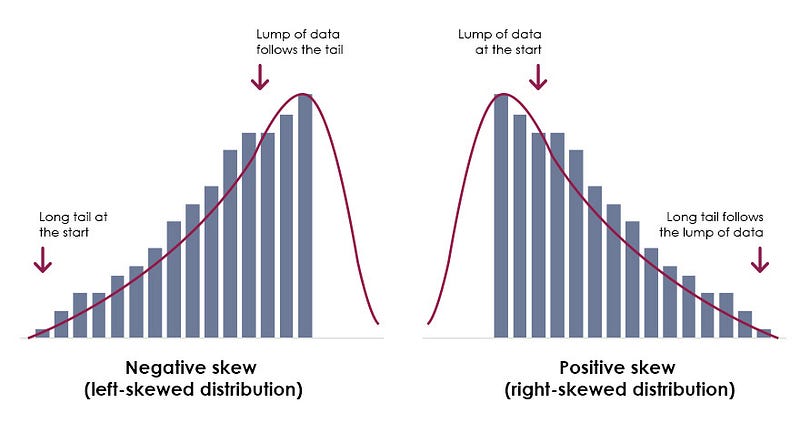
2. Skewed Distributions: In a skewed dataset (one that leans heavily toward higher or lower values), the mean tends to be pulled in the direction of the skew, while the median remains closer to the center of the data. For example, in a left-skewed distribution (where most values are high), the mean will be less than the median.
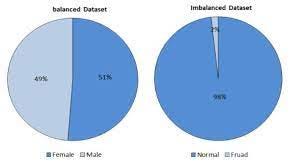
3. Balanced vs. Imbalanced Data: In perfectly symmetric distributions, mean and median are equal. However, as data becomes imbalanced, the gap between these two measures widens. This is why understanding both metrics together is often necessary when analyzing data.
Application in Different Data Types
The choice between mean and median depends on the nature of the dataset and the insights you wish to draw. Here are some scenarios that illustrate when one measure might be preferable over the other:
1. Income Data: Consider salary data within an organization. Income distribution is usually right-skewed, with a few individuals earning significantly more than the majority. In such cases, the mean might overstate the “average” income. The median is a more realistic indicator of what most employees earn because it’s less affected by high salaries at the top.
2. Test Scores: When analyzing test scores, especially in education, the median can often give a better sense of the general performance of a class. Suppose a few students score exceptionally high, while most others score around average. The mean could be misleading, suggesting a performance level that few students actually achieve.
3. Real Estate Prices: Real estate markets often feature a wide range of property prices. Outliers — such as extremely expensive properties — can distort the mean, making it seem as if homes are pricier than they are. The median price, however, tends to reflect the price point at which most transactions occur.
Real-World Examples
My inspiration for writing this article came from the Placement Brochure of ISI Delhi. While reviewing the brochure, I noticed that the mean and median package figures were different, sparking my interest in understanding this difference better. This distinction is not just academic — it directly impacts how prospective students and employers interpret placement results.
For example, let’s assume the placement packages of five students are {8 LPA, 10 LPA, 12 LPA, 15 LPA, 40 LPA}. Here, the mean package is 17 LPA, while the median is 12 LPA. The significant difference between these two figures arises due to the high outlier (40 LPA), which inflates the mean. This can lead to a misleading perception of what students generally earn. The median, however, more accurately reflects the typical package that students receive.
Such real-world scenarios emphasize that knowing when to use mean versus median can make a significant difference in the conclusions drawn from data analysis.
Conclusion
Understanding the difference between mean and median is essential for effective data analysis. The mean gives us an overall average but can be heavily influenced by outliers, making it less reliable in skewed datasets. The median, on the other hand, provides a better measure of central tendency when dealing with imbalanced data or outliers, offering a clearer picture of typical values. Choosing the right measure depends on the data type, its distribution, and the insights you seek. For datasets prone to outliers or skewed distributions, median is often more representative, while mean works well for balanced data without significant extremes.
After a long break from writing, I’m excited to return with this article, inspired by my recent experience with the placement data from ISI Delhi. I’ve been working on other projects, which I’ll share soon, but I felt this topic was both timely and essential for anyone navigating the complexities of data interpretation.
This article should offer a comprehensive yet practical understanding of why knowing the difference between mean and median is crucial in real-world data analysis. Whether you’re analyzing salaries, test scores, or market trends, the right measure can provide the most accurate insight.


