
The black swan — A day in the life of a Sports Betting industry Data Analyst.
The black swan theory is a metaphor that describes an event that comes as a surprise and can have a major negative effect. In terms of an operator in the iGaming Industry this is the worst case scenario — the company suffers significant major losses due to sporting results out of their control.
Table of Contents
- Introduction
- Data Collection 1
- Data Collection 2
- Monte Carlo Simulation
- Results
- Conclusion

Introduction
The duties of a data analyst are quite broad these days. A Data Analyst in most fields can be expected to clean data, prepare data for models, create functional models, provide insights and recomendations, forecast and automate reports for stakeholders. In my specific field over the past two years in the iGaming industry I have completed all of these aspects at some point. For this article I am going to detail on one such aspect completed which has relevance in answering the following forecasting problem which we will assume a fictional manager asking you — a working data analyst in this sector to simulate the potential PnL for any given day, with particular interest in the company’s highest handle day. The purpose of this forecasting is to identify the “black swan” and the probabilities and expected PnL the firm should expect to make. This will help ease higher managements concerns over a bad day at the office.
To conduct this task the data analyst will need to source the data for the highest handle day in the last year, then retrieve the data pertaining to the bets taken that day which will include the bet type, price and stake. The forecasting method used will be a monte carlo simulation and the results of this should be presented with insights.
**for this exercise I will provide code examples of how this task was approached but the fields relating to the queries have been altered and do not represent actual fields. The bet data was randomly generated using a number of presets that aimed to mimic a real life iGaming data set.
Data Collection 1
SQL or structured query language has been around a long time. Data Analyst’s working with big data in the industry must know how to collect the data. Most companies will have a relational database housed on site or in the cloud. The following query relates to gathering the highest handle in the last year for a company who operates in Europe (again, these are made up). VIPs or customers who are heavy stakers tend to be excluded from this type of analysis as their particular bets can inflate or destroy PnL on any given day and they are not reflective of an overall customer base.
This simple query will return for the purposes of this hypothetical assignment.
Day — 2023–05–28
Stake — 10 million
Bets — 100,000
%sql

SELECT DATE(A.SettledDateLocalTime) AS Date,
       SUM(A.Stake) AS TotalHandle,
       COUNT(A.BetIdentifier) as UniqueBets

FROM exampleSchema.BetsTable A
WHERE DATE(A.SettledDateLocalTime) > (CURRENT_DATE() - INTERVAL 1 YEAR)
and A.CustomerIdentifier NOT IN     ('1234567','12345678','123456789')

and A.Country <> 'USA'
and A.Stake > 0

GROUP BY Date
ORDER BY TotalHandle desc;
Data Collection 2
Fantastic, we have the day that we need to focus on for the rest of the task. This so happens to be the final day of the Premier League season with many other high level Football games on that day. The below is an example of retrieving the fields needed for the monte carlo simulation. This is one row per bet level information. The probability field is important, as this will be one of the main columns used in the simulation. The percentage chance for any sports selection can be found by dividing 1/odds. But there is a catch that bookmakers include margin to inflate the chances of a team winning. For this exercise the straight up probability cannot be used as it will include this margin. So for example here I will assign singles as 3% margin and multiple bets including bet builders as 10%, again just for illustration purposes. PySpark is essentially the big data version of Python in the cloud, it works great for big data work and has a handy integration with SQL which is used to extract the data from the database. I will turn this spark dataframe to a pandas dataframe to conduct the simulation, I have used pyspark to do this previously but here I will do it in straight up regular python.
%python

df = spark.sql("""

    SELECT
        A.LocalBetPlacedDate,
        A.BetIdentifier,
        A.SettledDateLocalTime,
        A.Sport,
        CASE
            WHEN A.BetBuilder = 1 THEN 'BetBuilder'
            ELSE A.TypeOfBet
        END AS TypeOfBet,
        A.Stake,
        A.BetPrice,
        A.Stake * A.BetPrice AS Liability,
        ROUND((1 / A.Price) * (1 - CASE WHEN A.TypeOfBet= 'Single' THEN 0.03 ELSE 0.10 END), 10) AS Probability

        FROM
        exampleSchema.BetsTable A

    WHERE

        DATE(A.SettledDateLocalTime) = '2023-05-28'

        and A.CustomerIdentifier NOT IN ('1234567','12345678','123456789')
        and A.Country <> 'USA'
        and A.Stake > 0


""")


df = df.toPandas()
Monte Carlo Simulation
Monte Carlo simulations are a powerful computational technique used in various fields such as finance, engineering, and science. They rely on random sampling to estimate complex outcomes or solve problems that may not have deterministic solutions. The Monte carlo simulation got its name from a very famous night in a monte carlo casino, if you have not heard about this please look it up on youtube.
In a Monte Carlo simulation, a large number of random samples are generated based on input distributions or parameters. These samples are then used to simulate a number of possibilities, in this example its the range of PnL on a big day. A very strong risk assessment. The higher number of simulations results in a more accurate forecast, by convention 10,000 is seen a good number, although this could be 100,000 based on the requirement and processing power available.
The code for a monte carlo simulation is quite small and definately not as complex as you might have assumed. The key aspect of this code is that in each iteration of the 10,000 simulations a column is created with a random number generator which assigns each row a value between 0 and 1. If the value in this column is less than the probability column (which is the probability of a bet winning) then a number 1 is assigned to the Result column. Then the simulated_pnl column calculates either the winnings if it was a simulated win which would always be a minus figure or the stake back to the firm, a positive number.
Each simulation is stored in a list called results which appends the Total PnL for that run. Then a histogram is plotted to show results and a seperate datafram is created which records the Simulation run number, the PnL for that run, the total stake which is constant and the margin.
num_simulations = 10000

results = []

for _ in range(num_simulations):
    # Create a new DataFrame for each simulation iteration
    df['Random'] = np.random.rand(len(df))

    df['Result'] = np.where(df['Random'] < df['Probability'], 1, 0)

    df['Simulated_PnL'] = np.where(df['Result'] == 1, ((df['Stake'] * df['BetPrice']) - df['Stake']) * -1, df['Stake'])

    # Calculate and collect the total PnL for this simulation run
    total_pnl = df['Simulated_PnL'].sum()
    results.append(total_pnl)

# Plot a histogram of the results
plt.figure(figsize=(16, 8))
plt.hist(results, bins=100, edgecolor='k', alpha=0.7, color='red')
plt.xlabel("Total PnL")
plt.ylabel("Frequency")
plt.title("Monte Carlo Simulation Results", fontsize=16)
plt.show()

# Create a DataFrame from the results list and add an iteration column
result_df = pd.DataFrame({'Simulation Number': range(1, num_simulations+1), 'Total_PnL': results})

result_df['Stake'] = df['Stake'].sum()
result_df['Margin'] = result_df['Total_PnL'] / result_df['Stake']
Results
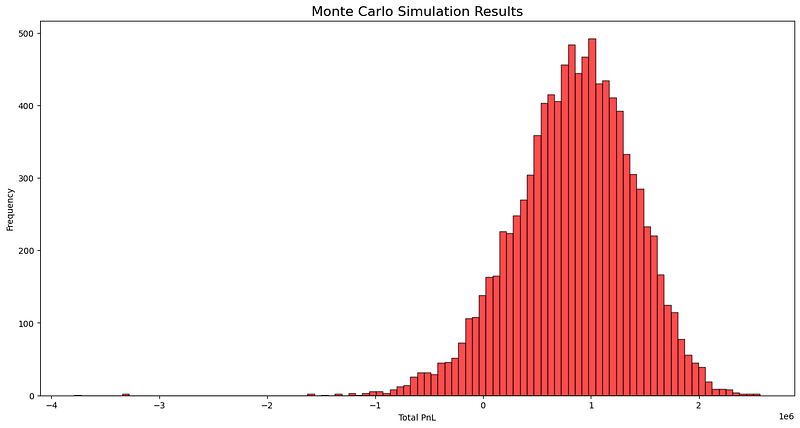
The results of the simulation show that the expected PnL the firm could expect is approximately $1,000,000. This occurred the highest number of times at just under 500 times. In three simulation’s there is losses of over 3 million. 3/10000 equates to a 0.0003% probability. It is unlikely, but never impossible. Recording a negative PnL has a chance of 7%. The figures and their probabilities would change on any given day as it is ultimately decided by the stakes on certain selections. The pitfall of this approach is the undoubted correlation of multiples and selections, for example if the top 6 backed teams in singles and multiples all won then the losses will be compounded and a negative PnL is highly likely. This approach takes each row as a unique selection, when in reality some teams are placed in bets more often than others. But for this purpose — the findings are that that doomsday scenario has an extremely low probability. Upper management can rest easy ;)
Conclusion
The life of a data analyst can be a challenging one, but the duties and experience gained in several different aspects mean that it is a highly rewarding job. The black swan is the worst case scenario and there are several methods in the iGaming industry to forecast this. The monte carlo is one such method, it has its limitations in some aspects, but ultimately it provides a high class approximation of probabilities pertaining to PnL and risk forecasting. Higher number of simulations result in a better approximation but these can be dependent on the scenario and the processing power available to the analyst. I hope you enjoyed this article about a day in the life of a data analyst in the iGaming sector. Follow me for more content relating to data analytics and more commonly football analytics. Have a good one!


