The Best of new Power BI features in 2023 vol. 1
2023 brings a lot of great new features to Power BI. Here are the most important ones.
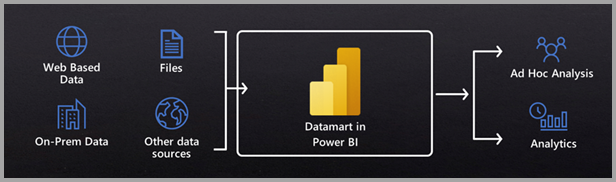
Datamarts
Datamarts help bridge the gap between business users and IT. Datamarts are self-service analytics solutions, enabling users to store and explore data that is loaded in a fully managed database. Datamarts provide a simple and optionally no-code experience to ingest data from different data sources, extract transform and load (ETL) the data using Power Query, then load it into an Azure SQL database that’s fully managed and requires no tuning or optimization.
Once data is loaded into a datamart, you can additionally define relationships and policies for business intelligence and analysis. Datamarts automatically generate a semantic model or semantic model, which can be used to create Power BI reports and dashboards. You can also query a datamart using a T-SQL endpoint or using a visual experience.
Datamarts offer the following benefits:
- Self-service users can easily perform relational database analytics, without the need for a database administrator
- Datamarts provide end-to-end data ingestion, preparation and exploration with SQL, including no-code experiences
- Enable building semantic models and reports within one holistic experience
Datamart features:
- 100% web-based, no other software required
- A no-code experience resulting in a fully managed datamart
- Automated performance tuning
- Built-in visual and SQL Query editor for ad-hoc analysis
- Support for SQL and other popular client tools
- Native integration with Power BI, Microsoft Office and other Microsoft analytics offerings
- Included with Power BI Premium capacities and Premium Per User
(source Power BI Blog)
Read more about Datamarts:
Multi-language reports
Having multi-language functionality in Power BI is beneficial because it helps people who speak different languages to understand and use the tool easily. This means that whether you speak English, Spanish, or another language, you can work with Power BI comfortably. It makes reports and dashboards more accessible to a diverse group of users, making collaboration and communication smoother in a global or multilingual environment.
Read more about Multi-language reports:
Apply All Slicers Button
This new button brings the possibility to postpone the processing of slicer changes until the user clicks on it. This is useful, especially when the most common scenario for the report is using multiple slicers. Originally, a change of every single slicer updates the entire report. Now, the user can choose values in all slicers and click on the Apply All Slicers button to update visuals accordingly.
If you want the user to decide which scenario he prefers, you can use bookmarks to hide the Apply All Slicer button.

Read more about Apply All Slicer button:
PowerPoint integration
PowerPoint is still the main presentation tool for many companies, and putting print screens from Power BI into PowerPoint was disabling one of the main benefits of Power BI reports, the possibility to adjust reports dynamically on the fly.
With improved and now generally available PowerPoint integration, you can embed full Power BI reports or specific visuals and deliver full report flexibility directly from PowerPoint without switching to Power BI.
Read more about PowerPoint integration:
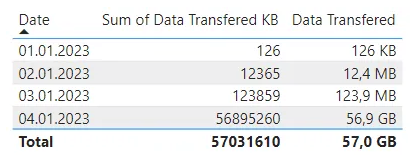
Dynamic Format Strings for Measures
This new feature allows dynamically format displayed values for measures in Power BI visualizations. Typically, we will use it in case we would like to change the format of numbers based on their value or based on currency type. This helps to keep numbers in visualizations in a compact format.
Read more about Dynamic Format Strings for Measures:
- Power BI Feature News — Dynamic String Format for Measures
- Power BI Blog — Dynamic format strings for Measures
This is for the first part of The Best of 2023 for Power BI. Stay tuned for second part.
Don’t forget to subscribe to
👉 Power BI Publication
👉 Power BI Newsletter
and join our Power BI community
👉 Power BI Masterclass