
The best Matplotlib cheat sheet!

Welcome back! Matplotlib is one of the most important packages for Python, I’ve personally used it for many data science related tasks, so what if there was a cheat sheet that showcased the basics of this package? Well, there are actually a ton of them, so let’s talk about the best Matplotlib cheat sheet that was actually developed by the creators themselves. If you want to jump straight to the sheet, check out the link below:
Let’s look over some of the key components of these sheets. Starting off, these sheets are stored on GitHub, so you will be able to see a few of the different sheets available. On the main sheet, you will see some of the basics (quick start) functions of this package:

After the basics, you will see the basic layouts of the subplots that are available:

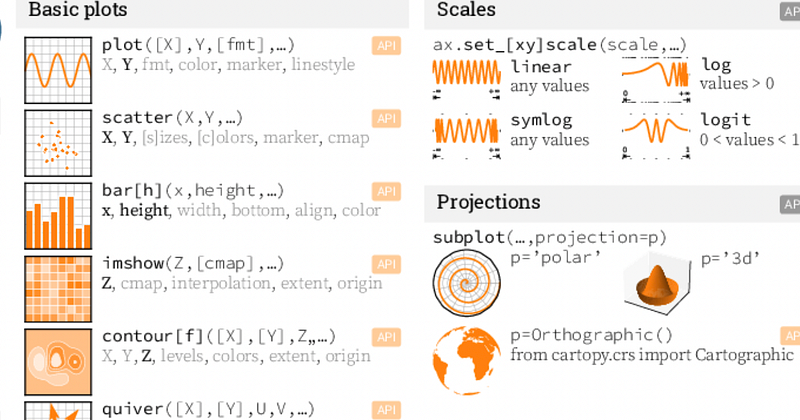
Right after that, this sheet breaks down the basic plots you can build out, these include plots, scatters, bars and so many more. On top of this, you can also use scales and projections as well:
What’s even cooler are the advanced plots, I’ve personally never used these, but they are awesome features to use as well:

What’s even cooler about this is the customizability, this sheet does a great job at breaking down the different colors and colormaps available:

There you have it! This is definitely one of the best cheat sheets for Matplotlib, do you plan on using this sheet? I would love to hear your thoughts about it!
As Always
if you have any suggestions, thoughts, or just want to connect, feel free to contact/follow me on Twitter! Also, below is a link to some of my favorite resources for learning programming, Python, R, Data Science, etc
Thanks so much for reading!