
The art and science of data visualization
Transforming raw data into compelling visual stories.
In today’s digital world, awash with vast amounts of big data and complex algorithms, it’s easy to imagine the average individual feeling adrift in a sea of numbers and information.
However, it’s the art of Data Visualization that serves as a lifeline in this scenario. As Alberto Cairo defines in his book The Functional Art:
Data visualization is a collection of methods that use visual representations to explore, make sense of, and communicate quantitative data.
Think of Data Visualization as our compass, guiding us through this numeric ocean, translating vast datasets into meaningful and understandable insights.
So, what really constitutes an effective visualization?
What differentiates a visualization that illuminates from one that only adds to the confusion?
In our journey today, we delve into the core principles of Data Visualization.
This article aims to unravel the mysteries of this crucial skill, uncovering how it illuminates the path through the data-driven landscape we navigate daily.
So let’s try to understand together the theory behind Data Visualization 👇🏻
The Basics Behind Data Visualization
In the field of data science, one of the most vital yet challenging skills is the art of storytelling through data. And this is precisely the field of Data Visualization. A glance at the dictionary definition gives us a clear starting point:
“The act of representing information as a picture, diagram or chart, or a picture that represents information in this way”
At its core, Data Visualization is about shaping a narrative from a dataset. It transforms data into a form that is not only digestible and visually appealing but also delivers a powerful impact.
While it may not have the same allure as other fields like machine learning, Data Visualization is a fundamental aspect of a data scientist’s toolkit.
In our modern, data-centric world, think of Data Visualization as a pair of glasses that brings clarity to a blurry scene.
So… a natural question that arises is, why do we need Data Visualization?
A Brief Overview of the Data Visualization Field
During the XX century, data was predominantly displayed in stark tables, with little consideration for ease of interpretation.
Not long ago, the types of charts and graphs we instantly recognize today would have been utterly foreign to people.
Modern concepts like Pie Charts, Bar Charts, and trend lines are quite modern developments. William Playfair is heralded as one of the pioneers of modern Data Visualization, credited with creating many of the graphical formats we use today.
And the big question is… why did he do so?
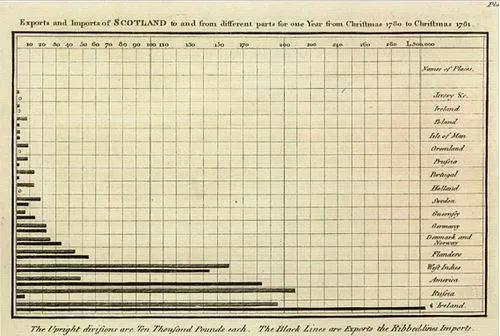
When trying to identify Scotland’s most significant economic ties, Playfair realised that crafting a visualization with bars representing the number of importations and exportations for each partner smoothed the process.
And this is how the Bar Chart was born.
Bar Chart — 1781
Bar Chart Playfair’s bar chart depicted Scotland’s trade balance with various European territories and the New World.
A glance at this chart revealed Scotland’s major trading partners and their respective trade volumes and balances.
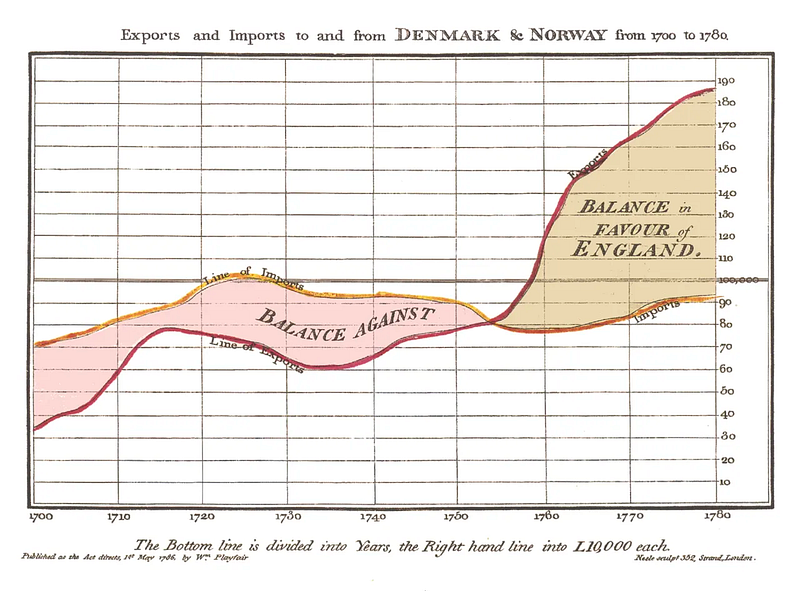
Line Chart — 1786
For England, with more data at his disposal, Playfair was able to produce time-series graphs.
At a glance, it highlights that until 1755, England had an unfavorable trade balance, which shifted to a favorable one from that year onwards.
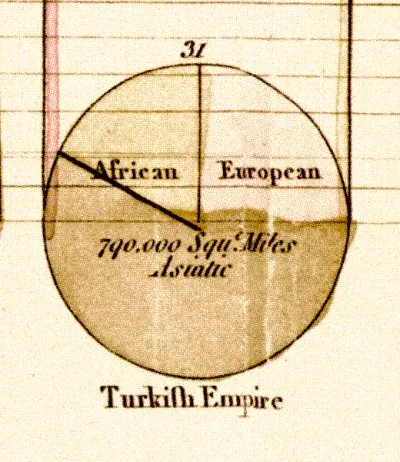
Pie Chart — 1801
Fifteen years later, in 1801, Playfair designed the first known pie chart. This chart illustrates the proportions of England’s total trade volume with various regions of the world.
So basically, Data Visualization was born as a way to smooth the process of interpreting data.
It serves as a vital bridge, particularly for those who aren’t fluent in the complex languages of numbers and algorithms, allowing them to navigate and comprehend intricate data stories with ease.
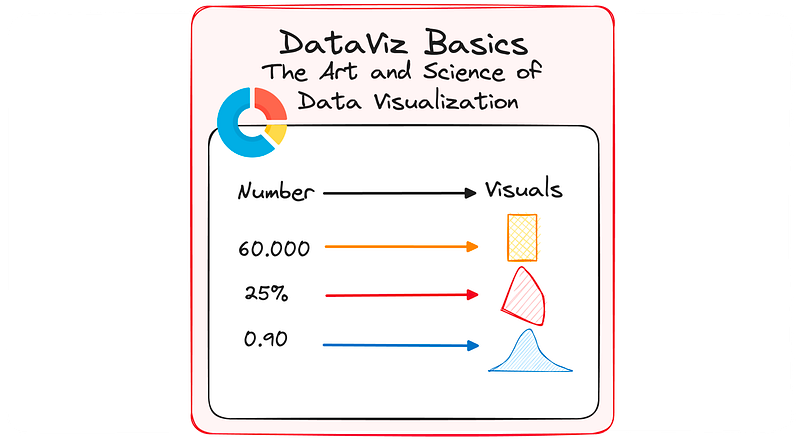
DataViz Basics
One of the foundational concepts of the field of Data Visualization is that every chart or graphical representation we encounter is fundamentally constructed from two primary elements:
- Data
- Visual elements
It is quite difficult to attribute this specific statement to a single individual, as this is a basic idea held and expressed by many experts in the field.
However, one notable figure in Data Visualization who has emphasized the importance of combining data and visual elements effectively is Edward Tufte.
He has extensively written regarding the principles of good graphical representation, highlighting the interplay between data and visuals in creating meaningful and clear presentations of information.
1. The key element — Data
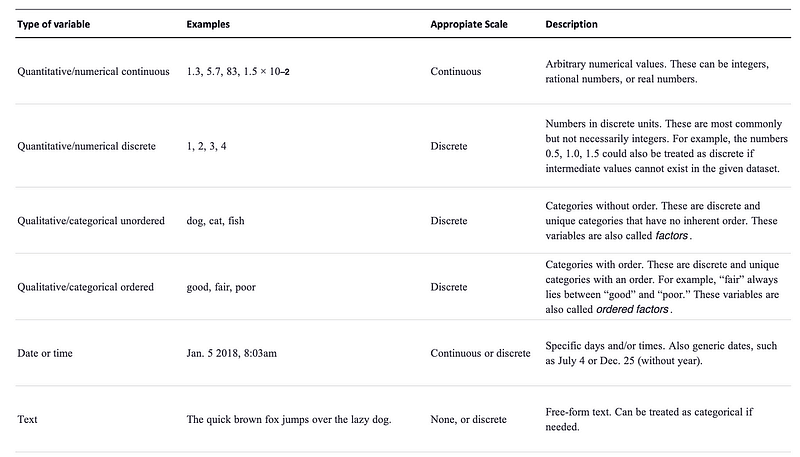
When contemplating Data Visualization, it’s common to first think of numerical data. However, this represents just a fraction of the wide variety of data types at our disposal. For effective visualization, it’s crucial to recognize and utilize the full spectrum of data types available.
This spectrum includes both continuous and discrete numerical values. According to Clause O. Wilke, beyond these, data can also manifest as discrete categories, temporal elements (like dates and times), and even textual information.
Each of these data types brings its own nuances and requires different visualization approaches. To categorize these data types further, we can consider:
- Numerical data as Quantitative, offering measurable and countable characteristics.
- Categorical data as Qualitative, which includes dates, times, and text. It emphasizes non-numeric aspects and qualities.
Recognizing these categories is fundamental in data visualization, as it guides us in choosing the most appropriate and effective methods to represent our data.
2. The Art of Encoding Data — Visual Encodings🎨
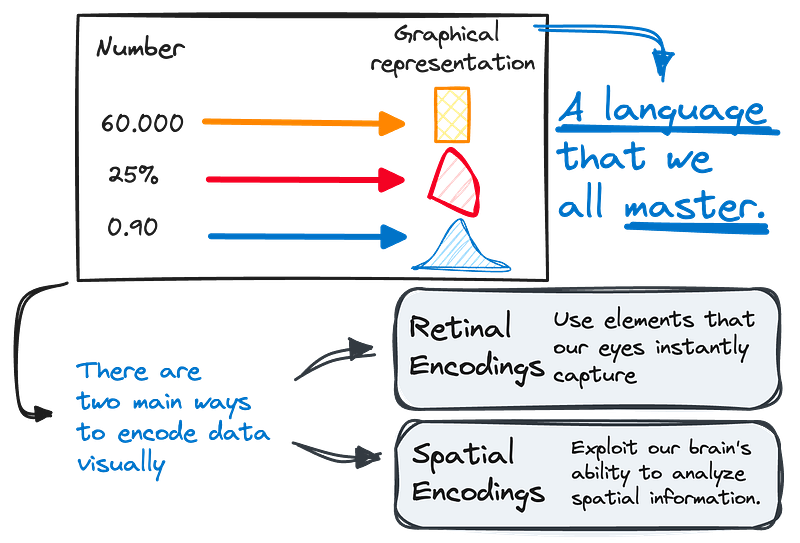
At the heart of Data Visualization lies the skill of visual encoding, where abstract numerical data is transformed into easily understandable graphical forms. This is akin to speaking a universal visual language, where everyone, regardless of their background in data analysis, can interpret the information at a glance.
Interestingly, diverse visualization types, such as scatterplots, pie charts, and heatmaps, share a common visual dialect.
This shared language is all about converting data values into visual elements — think of it as turning cold numbers into vivid, colorful representations on your screen or paper.
Yet, here’s a fascinating aspect: There’s an almost endless array of methods to visually represent data!
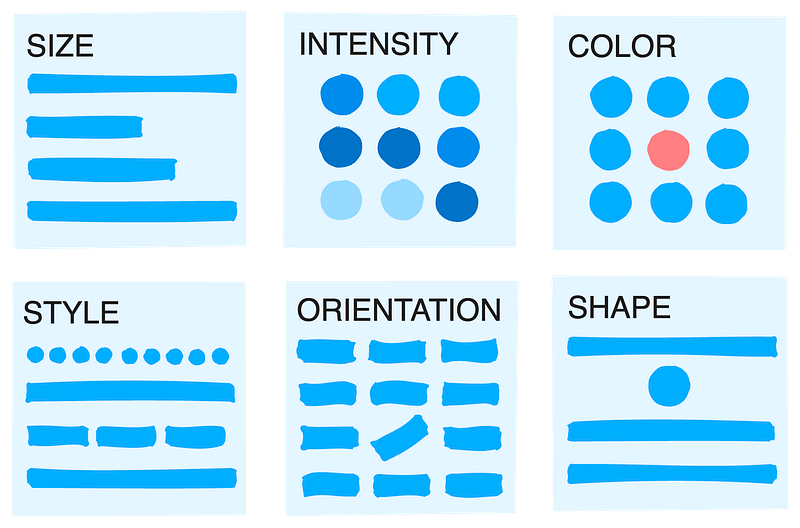
To simplify these methods, and according to T.Munzner, there is a primary enoding type called Retinal Encoding.
- Retinal Encodings: This category includes visual characteristics like shape, size, color, and intensity. These are the attributes that immediately grab our attention, acting as the visual ‘hook’ of the data story. Each element’s distinct appearance plays a crucial role in how we perceive and interpret the data.
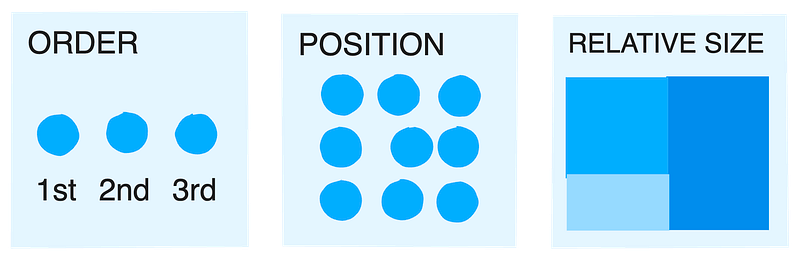
On the other hand, and commonly associated with our brain’s spatial skills, there is a second group that some people call “spatial encodings”.
- Spatial Encodings: These leverage the spatial awareness capabilities of our brain’s cortex to represent information. This encoding approach can be realized by utilizing a position on a scale, establishing a specific sequence, or employing relative sizes for representation.
Incorporating various encodings into a single chart is technically feasible, yet it risks overwhelming the viewer. Simplicity in data visualization is key, too many encodings can muddle the message.
Ideally, limiting to one or two retinal encodings per chart enhances clarity and comprehension.
Remember, in Data Visualization, embracing minimalism often yields the most impactful results.
It’s akin to seasoning a meal — a judicious sprinkle of salt and pepper can elevate the dish, whereas an excessive amount can spoil it.
The choice of encoding should align with the narrative you aim to convey with your data. Therefore, a more pertinent question to ponder is not just which encoding to use, but how it serves the story your data tells.
Choosing the Right Visualization
In the wide landscape of Data Visualization, it’s essential to select the most effective visual encodings that match the nature of your data.
Not all visualization methods suit every kind of data, so it’s crucial to pair the right type of visualization with the specific characteristics of the data you’re working with.
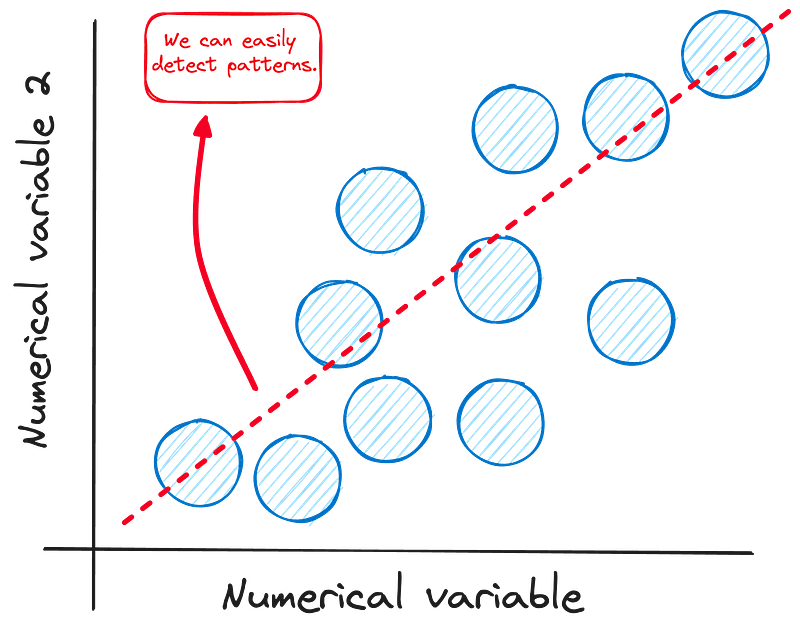
For instance, when dealing with continuous variables like weight and height, their best representation often comes from positioning them on a scatter plot. This approach effectively communicates variations and relationships within the data.
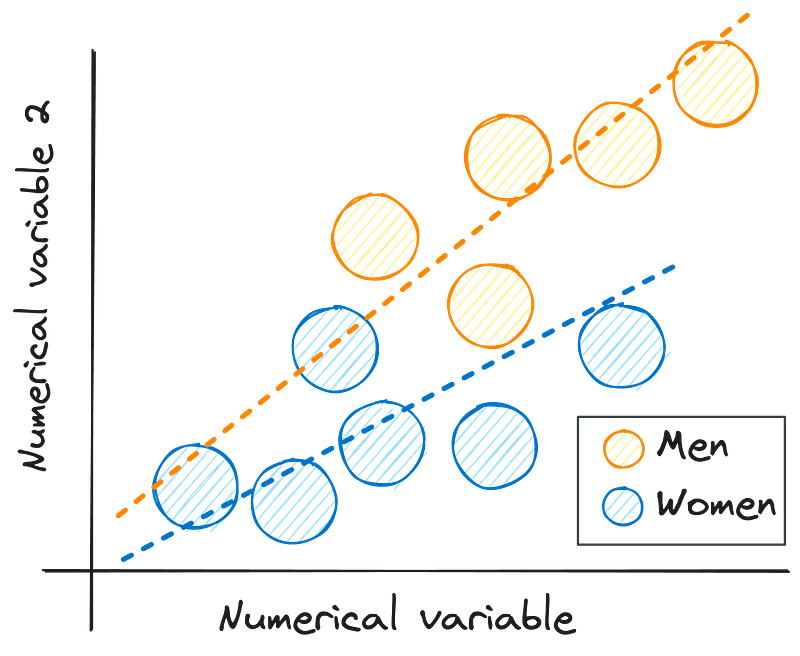
On the other hand, categorical variables, which include categories like gender or nationality, are more effectively represented through distinct visual elements such as color coding or shape. This distinction allows these variables to stand out clearly and be easily interpreted in the context of the visualization.
Underpinning the effectiveness of these choices are fundamental theories that explain why certain visual encodings resonate more intuitively with us.
Understanding these underlying principles can guide us in creating more impactful and comprehensible visualizations.
The Core of Effective Data Visualization
In Data Visualization, striking a harmonious balance between aesthetic appeal and practical functionality is essential. Sometimes, choosing certain visual encodings, even if they appear less efficient, is intentional to convey a specific message or evoke emotions.
In our contemporary world, where data streams are ever-expanding, the significance of crafting visual stories that resonate is paramount, particularly when our audience comprises individuals not well-versed in data.
Effective data visualization transcends mere number presentation, it involves weaving a compelling narrative with our data.
It’s about animating our data, interweaving stories that establish a link between abstract figures and tangible, real-world consequences and insights.
For those of us passionate about technology and data, Data Visualization is more than a skill — it’s an art form, a unique language, and a bridge connecting us to the wider world.
Did you like this MLBasics issue? Then you can subscribe to my DataBites Newsletter to stay tuned and receive my content right to your mail.


