
The 4 best command line tools for monitoring your CPU, RAM, and GPU usage
Want to be inspired? Come join my Super Quotes newsletter. 😎
A powerhouse PC is a must-have if you’re serious about doing anything data-driven these days. Data Science tends to be RAM hungry, Reinforcement Learning likes to eat up CPU, and Deep Learning devours GPU.
When working on applications that are so resource hungry, it’s important to know if your PC is being using efficiently.
- Is your algorithm bottle-necking on CPU? Can it use more cores?
- Do you have enough RAM or is your memory usage spilling over into swap (disk memory, very slow)?
- Is your CPU or GPU running too hot? Intel CPUs and Nvidia GPUs get speed-throttled when they heat up past a certain temperature
All of these questions and more are important to consider, since they effect the speed at which you can work on your Data Science and AI projects. When you’re able to see exactly how much CPU, RAM, and GPU your software is using, it’ll be much easier to make your implementations more efficient since you know exactly where the bottleneck is coming from.
Here’s a list and showcase of the 4 best command line tools for monitoring your CPU, RAM, and GPU usage. You use them in parallel to your process to see which resources its consuming and optimise (or just upgrade your PC!) from there!
HTOP — CPU, RAM
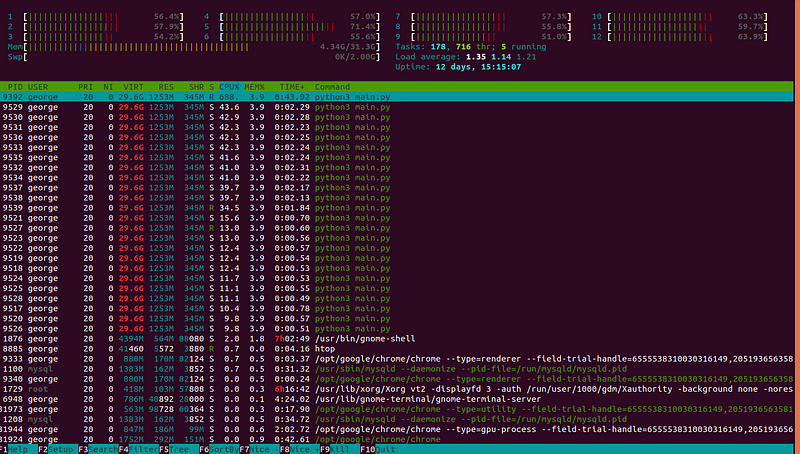
HTOP is an interactive, command-line based system-monitor for viewing the running processes on your PC. You can think of it like the system monitor GUI, only better: it’s on the command line and colour coded!
At the very top of the htop output, you’ll see the percent usage of each CPU core, as well as the total usage of the RAM and swap memory. This is great for seeing if your program is using all cores and how much. You’ll also be able to see if you’re hitting your memory limit.
Below that, htop shows you the CPU, RAM, and swap memory usage for each running process. It also shows you the command which was used to start the process. If a process has multiple threads, the RAM usage of those threads is grouped together while the CPU usage is calculated on a per-thread basis, just like in the photo above with python3 main.py .
You can install htop with a simple apt command:
sudo apt install htopAnd run it by typing htop in your command line and hitting enter!
Glances — CPU, RAM, Disk I/O

Glances is a free software, developed in Python, that can be used to monitor the total CPU, RAM, and Disk I/O of your system.
Just like htop, you’ll get to see the total CPU and RAM usage of each process on your system. The bonus of using glances is that you get to see a lot of hard drive / disk information:
- Which disk each process is running on (far left)
- Information about the total capacity and usage of each disk (far left)
- Number of reads and writes to disk per second, in bytes. This is perfect for check if your disk speed is a bottleneck, since HDDs and SSDs come with a max speed for read / write.
- More detailed RAM statistics including the buffer and cache
In addition, stats can be automatically written to disk or sent to a remote server.
You can install glances with a simple apt command:
sudo apt install glancesAnd run it by typing glances in your command line and hitting enter!
Sensors — CPU (with temps)
So far, HTOP and Glances were able to give us great insight into the CPU usage, RAM, and Disk I/O, all important for discovering any bottlenecks and improving our code’s efficiency.
But what about heat?
CPU manufacturers like Intel build in a safety function into their processors. If the CPU temperature crosses a certain limit, its speed gets throttled to avoid overheating.
This can kill your program’s speed! We could be looking at htop, seeing 100% CPU usage and thinking all is well. Meanwhile, our CPU speed is being capped off, not to mention the physical damage to the component itself.
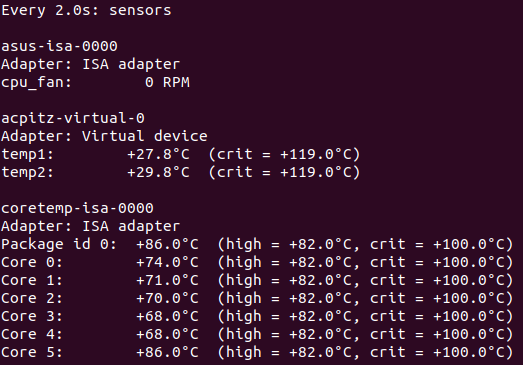
To monitor the temperature of your CPUs, you can use a tool called Sensors.
On first installation, sensors will detect each relevant device (processors, fans, etc) and prepare to measure the temperature. Once you run it, the sensors app is able to measure the temperature of each core of a CPU as well as the speed of all the fans. Check out the output below!
You can install sensors with a simple apt command:
sudo apt-get install lm-sensorsThen detect all the devices like so:
sudo sensors-detectAnd finally run sensors to keep an eye on your CPU temps!
watch sensorsNvidia SMI — GPU
Finally, we get to the GPU!
Similar to CPUs, the most important things to measure on the GPU are the usage and the temperature. Luckily, we can get both of those measurements using a single tool.
Nvidia has its own tool for measuring the usage and temperature of its GPUs called Nvidia SMI; SMI stands for System Management Interface. The nvidia-smi tool comes with NVIDIA GPU display drivers on Linux, so once you’ve got your GPU properly installed you can start using it.
To run it, just type watch nvidia-smi and hit enter. Check out the sample output below!

As you can see, nvidia-smi presents us with a lot of useful information:
- GPU memory usage in MB
- GPU power usage in Watts
- GPU temperature in Celsius
- GPU fan speed percentage
Aside from those hardware stats, we also get a list of each process that’s using the GPU, their individual memory usage, and type: C for compute and G for graphics (display).
Like to learn?
Follow me on twitter where I post all about the latest and greatest AI, Technology, and Science! Connect with me on LinkedIn too!


