
The 2023 Recession
If history repeats a seventh time, the next recession will start in 2023. We NOW have an inverted Yield Curve — find the meaning of that.
The FOMC (Federal Open Market Committee) has the responsibility to attain maximum employment and maintain stable prices. This means that it has the LEADERSHIP ROLE to control unemployment and inflation.
The FOMC uses data produced by other “Central Government” entities like, the Bureau of Labor Statistics (BLS), the International Monetary Fund (IMF), the Federal Financial Institutions Examination Council (FFIEC)*, to make decisions that affect market behavior. * — the FFIEC Board integrates data from the FRB (Board of Governors of the Federal Reserve System), the Federal Deposit Insurance Corporation (FDIC) and other three lesser known boards.
All of these boards are created by “ACTs” of congress for some specific purpose. They all have a whistle to blow (that is why they were created by congress). At the end of that rope it is CONGRESS putting all kinds of canaries in the coal mine for some early warning. The problem is, there are so many, there is always one that blows a whistle, then in boards like the FFIEC or the FOMC (the gorillas in the block), they are silenced. It is called a BUREAUCRACY for a reason. They are so perennial that their reason for being is to hush up early panic and let it become REAL PANIC when the freight train coming down the tracks cannot be stopped.
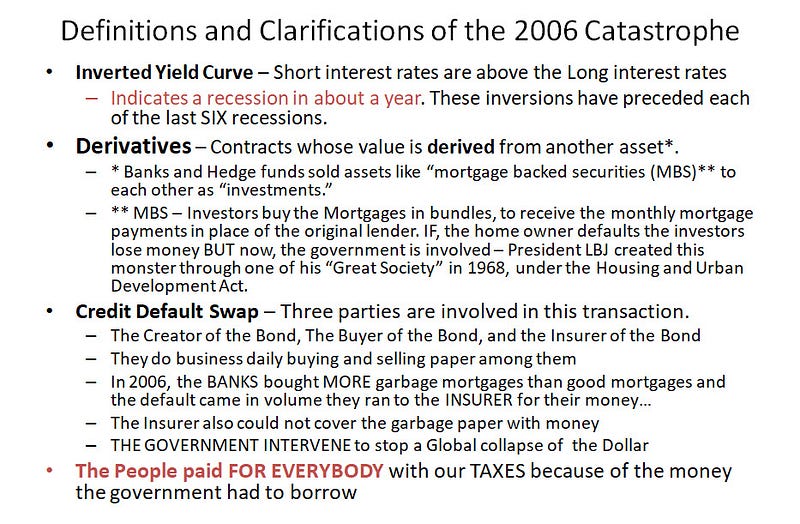
To understand how recessions happen in simple terms, a few financial terms are needed and then, study the 2006–2008 Market Catastrophe.
The Yield Curve Tells us Something about Future Economic Activity
It is important to understand Federal Bonds and why the exist. “Federal Bonds” or “Bonds” are a government tool to raise funds. They pay you interest when they mature (there are short term bonds and long term bonds). They are used for lowering longer-term interest rates AND moving money around the economy. When we buy Bonds, we put money in our Nations Wallet.
In a healthy market, long-term bond interest rates are HIGHER than short term interest rates. That makes sense, you are rewarded for your trust in the government long term plan and leadership.
When we plot a curve of the long term bond interest rate over time, we get a jagged up and down curve indicating at what percent the 10 year bond, 30 year bond, or any other bond interest rate is at that date. It is a curve of interest rate over time.
However, when a short term Yield Curve has HIGHER interest rates than a long term Bond Yields. The only way to read that is THE MARKET IS BETTING SHORT TERM WE ARE OKAY (they are buying those) but, they do NOT trust that in the LONG TERM, the economy will be okay.
SO, a YIELD CURVE is the ratio of the long term interest rate over the short term interest rate.
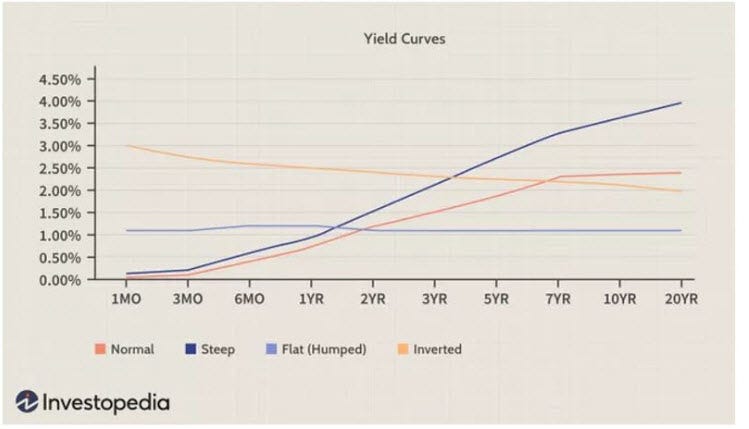
- A Steep Yield curve indicates strong growth in the economy Long term bonds interest rates are higher than short term interest rates — this usually also means strong GDP, we are growing the economy.
- A Flat Yield curve indicates weak growth — this may be okay short term but is not good long term. The GDP is not growing, jobs hard to find, there are some layoffs. The economy has no definite direction.
- An Inverted Yield Curve indicates negative growth — This currently bad for the economy and if it maintains over time, it leads to a RECESSION OR WORSE a market crash like it did in 2008.
An Inverted Yield Curve Preceded the Last SIX Recessions
In their Paper “What does the yield curve tell us about GDP growth?,” Andrew Ang, Monika Piazzesi, and Min Wei. 2005, tells us “the yield curve tells us something about future economic activity.” They modeled the dynamics of yields jointly with GDP growth. The purpose was to find a way to model, using Yield and GDP growth for forecasting GDP.
“Based on history a statistical forecast can be made. In 2006 the 10-Year Bond was at 4.56%, the 3 Month Bond rate was at 4.93%. This was the early warning canary. This was the week ending 2005.
That spread was (is) 37 negative points (56–93 = -37), It was in the negative range since August 2005. Focusing on the Yield curve and the Real Gross Domestic Product (GDP) using probabilities to predict a discrete event, there is a 44% chance of a recession in 2006.
Since 1960, the economy has been in a recession 14 percent of the time. So while not predicting a recession for sure, the Yield curve indicates that the odds are substantially greater than average. There is a link between the Yield curve and Economic Growth (GDP).”
The most important factor in all of these assessments is to KEEP INFLATION LOW. This is because inflation rates has a deep effect on the purchasing power and the purchasing power of “investment gains.”
An example from investopedia: “if funds used to purchase a certificate of deposit (CD) are set to earn 4% in interest per year and the rate of inflation for the same time period is 3% per year, the real interest rate received on the investment is 4% — 3% = 1%. The real value of the funds deposited in the CD will only increase by 1% per year, when purchasing power is taken into consideration.
If those funds were instead placed in a savings account with an interest rate of 1%, and the rate of inflation remained at 3%, the real value, or purchasing power, of the funds in savings will have actually decreased, as the real interest rate would be -2%, after accounting for inflation.”
Faith in the Administration and the Fed (FOMC) dictates behavior in the markets. With good leadership inflation can be stopped quickly once it starts. If inflation roots and stays bad things happen (a la 2006 see the logic map below).
The Snap Shot Look
What follows is a summary chart of the Market Crash of 2008. It is read from the bottom up. The bottom being the root causes of the crash. The arrows up lead to the consequences of the previous event(s). The banana red line indicates all the arrows contributed to the consequence. If one of the previous event had not happened, the crash would not have happened.
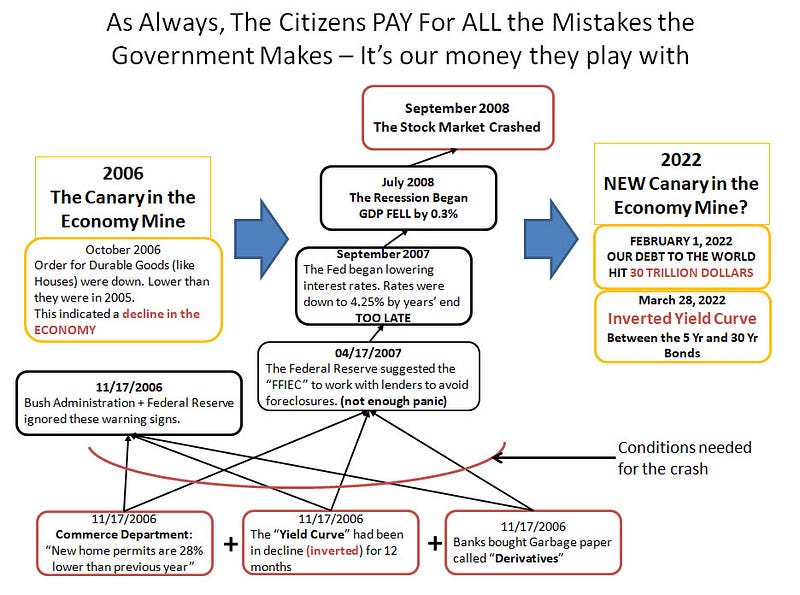
As noted in the chart above, we have two canaries in the Economic coal mine now. Watch carefully what develops in the next 6 Months with either the debt, does it keep growing? and the Yield curve, still inverted?


