Testing of Day Trading Strategies for Cryptocurrencies with Python on Binance Data: RSI Indicator
As a passionate crypto trader, I have always been fascinated by the potential for day trading strategies in the crypto market. With the increasing popularity and volatility of crypto coins, there is a wealth of opportunity for traders to make quick profits by buying and selling coins within a single day. However, finding the right strategy and executing it effectively can be challenging, especially with the vast number of crypto coins available on the market.

To help me find the most effective strategies for day trading crypto coins, I turned to Python and the data from Binance, one of the largest crypto exchanges in the world. In this article, I will share my experience and insights on how I used Python and Binance data to test and refine different day trading strategies for crypto coins.
Whether you are an experienced trader or a beginner just starting out, I hope this article will provide valuable insights and help you achieve better results in your day trading endeavours.
Disclaimer: Please note that I am not a professional trading advisor, and the information provided in this article is based on my personal experience and opinions. The crypto market is highly volatile and subject to unpredictable changes, and there is a risk of losing your investment. Please do your own research and seek professional advice before making any investment decisions. The information presented in this article should not be treated as investment advice, and all readers are responsible for their own investment decisions.
I have long dreamt of conducting a thorough testing of day trading strategies for cryptocurrencies and I am thrilled to finally have the time to bring this dream to fruition. In this article, I will take you on a journey through my thought process and share my Python code with you, so you can run your own tests and see the results for yourself.
My goal is to provide a comprehensive and accessible guide for traders who are interested in exploring day trading strategies for crypto coins. Whether you are an experienced trader or just starting out, I believe that this article will offer valuable insights and a solid foundation for your day trading journey. So, grab a cup of coffee, get comfortable, and let’s dive in!
Setting up the foundations
To get started, let’s define the input data that I will be using for my testing. I have decided to use Binance trading data for the top 20 cryptocurrencies based on their market cap. The data range I have chosen covers the last 100 days and I will be using 30-minute candle intervals to calculate technical indicators.
By using data from one of the largest crypto exchanges in the world and focusing on the top 20 coins by market cap, I aim to ensure that my tests are representative of the broader crypto market. By using 30-minute candle intervals, I am able to capture a sufficient amount of price action data while still maintaining a manageable amount of data points to analyze.
As mentioned earlier, I will be using Python as my language of choice for this testing project. To assist me in my analysis, I will be utilizing several Python modules, including python-binance, pandas, pandas-ta, and matplotlib. These modules are essential tools for traders and offer a wealth of functionality for data analysis and visualization.
To install these modules, you can simply run the following command in your terminal or command prompt:
pip install python-binance pandas pandas-ta matplotlib
And that’s it! You now have access to the powerful tools that I will be using for my testing. With these modules installed, you can start exploring your own day trading strategies and conducting your own tests with Python and Binance data.
Getting Trading Data from Binance
In the code below, I will retrieve the trading data for the top 20 cryptocurrencies from Binance and store it in a Pandas data frame. Pandas is a powerful Python library for data analysis and manipulation, and it is widely used by traders and data scientists alike. By storing our Binance data in a Pandas data frame, we can easily manipulate, analyze, and visualize our data using the many tools and functions provided by Pandas.
Here’s the code to retrieve the Binance data and store it in a Pandas data frame:
import pandas as pd
import matplotlib.pyplot as plt   # needs pip install
import time
import pandas_ta as pta
from binance.client import Client


api_key = "YOUR_BINANCE_API_KEY"
api_secret = "YOUR_BINANCE_API_SECRET"

client = Client(api_key, api_secret)

def get_data_frame(symbol='BTCUSDT', period='30m', timeframe='1 hours ago UTC'):
    try:
        bars = client.get_historical_klines(symbol, period, timeframe)
    except Exception as e:
        print('GET Data error', symbol)
        print(e)
        time.sleep(5)
        bars = client.get_historical_klines(symbol, period, timeframe)

    for line in bars:
        del line[7:]

    df = pd.DataFrame(bars, columns=['open_time', 'open',
                                     'high', 'low', 'close',
                                     'volume', 'close_time'])
    df.apply(pd.to_numeric)

    return df


top_coins = ['BTCUSDT', 'ETHUSDT', 'BNBUSDT', 'XRPUSDT',
             'ADAUSDT', 'DOGEUSDT', 'MATICUSDT', 'SOLUSDT',
             'DOTUSDT', 'LTCUSDT', 'SHIBUSDT', 'AVAXUSDT',
             'DAIUSDT', 'TRXUSDT', 'UNIUSDT', 'ATOMUSDT',
             'LINKUSDT', 'ETCUSDT', 'XMRUSDT', 'APTUSDT']

trading_data = {}
for coin in top_coins:
    trading_data[coin] = get_data_frame(symbol=coin, period='30m',
                                        timeframe='100 days ago UTC')
The trading data for the top 20 coins is stored inside the trading_data dictionary.
Relative Strength Index (RSI) indicator
Once we have retrieved the trading data and stored it in our Pandas data frame, we can start generating technical indicators. Our first stop in this journey is the very popular Relative Strength Index (RSI) indicator.
The RSI is a popular momentum indicator that measures the strength of a currency’s price action. It helps traders identify overbought and oversold conditions in the market, and it can also be used to identify trend reversals.
add this code snippet:
# adding RSI indicator to the trading data set
for coin in top_coins:
    trading_data[coin]['rsi'] = pta.rsi(close=trading_data[coin]['close'], length=14)

    print(coin)
    print(trading_data[coin]['rsi'].tail(2))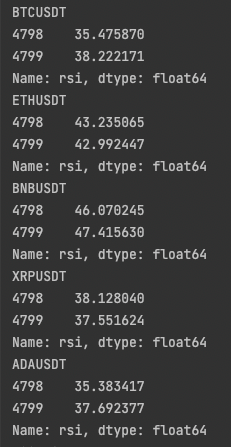
In addition to generating the RSI indicator, we can also visualize the data using the matplotlib library.
coin_for_plotting = 'BTCUSDT'
fig,ax = plt.subplots()
fig.subplots_adjust(right=0.75)

# Primary chart for Close Price
ax.set_xlabel('time', fontsize=14)
ax.plot(trading_data[coin_for_plotting].close_time, trading_data[coin_for_plotting].close, color='black')
ax.grid(axis="x")
ax.set_ylabel('close', color='black', fontsize=16)

# Secondary chart for RSI indicator
ax2 = ax.twinx()
ax2.plot(trading_data[coin_for_plotting].close_time, trading_data[coin_for_plotting].rsi, color='green')
ax2.set_ylabel('RSI', color='black', fontsize=16)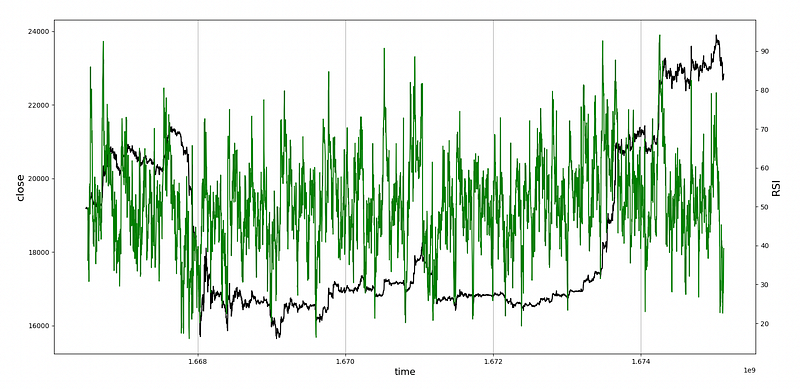
As you can see green line for RSI is quite jagged and erratic. We can try to smooth it a bit to get a better information value out of it. There are 2 options which we can try.
- calculating an rolling average
# Secondary chart for RSI indicator
ax2 = ax.twinx()
ax2.plot(trading_data[coin_for_plotting].close_time,
         trading_data[coin_for_plotting].rsi.rolling(30).mean(),
         color='green')
ax2.set_ylabel('RSI', color='black', fontsize=16)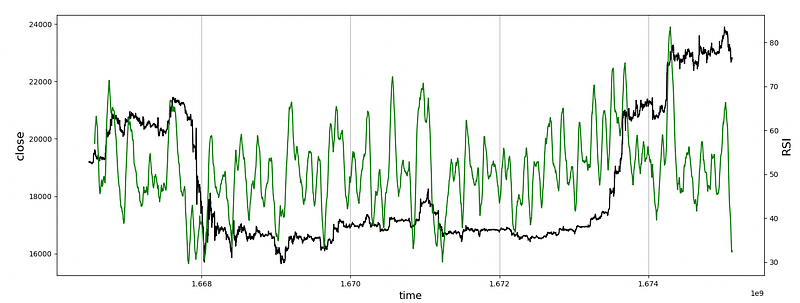
- increasing RSI length
# adding RSI indicator to the trading data set
for coin in top_coins:
    trading_data[coin]['rsi'] = pta.rsi(close=trading_data[coin]['close'], length=50)

    print(coin)
    print(trading_data[coin]['rsi'].tail(2))

coin_for_plotting = 'BTCUSDT'
fig,ax = plt.subplots()
fig.subplots_adjust(right=0.75)

# Primary chart for Close Price
ax.set_xlabel('time', fontsize=14)
ax.plot(trading_data[coin_for_plotting].close_time, trading_data[coin_for_plotting].close, color='black')
ax.grid(axis="x")
ax.set_ylabel('close', color='black', fontsize=16)

# Secondary chart for RSI indicator
ax2 = ax.twinx()
ax2.plot(trading_data[coin_for_plotting].close_time,
         trading_data[coin_for_plotting].rsi,
         color='green')
ax2.set_ylabel('RSI', color='black', fontsize=16)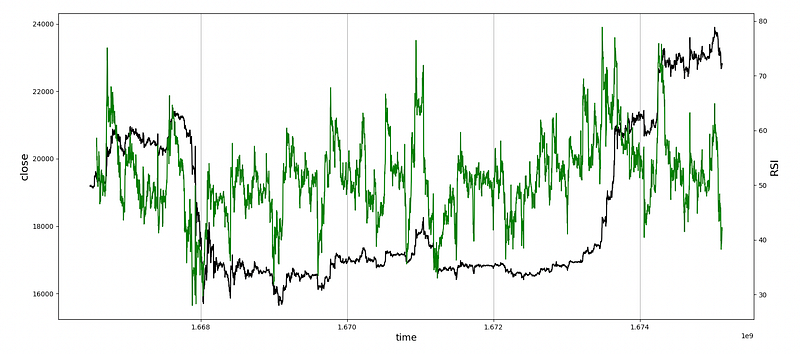
Personally I like the longer RSI length and it looks like RSI over 60 indicates a bull run, let’s visualise it again
# Secondary chart for RSI indicator
ax2 = ax.twinx()
ax2.plot(trading_data[coin_for_plotting].close_time,
         trading_data[coin_for_plotting].rsi,
         color='green')
ax2.set_ylabel('RSI', color='black', fontsize=16)
ax2.set_ylim(bottom=60)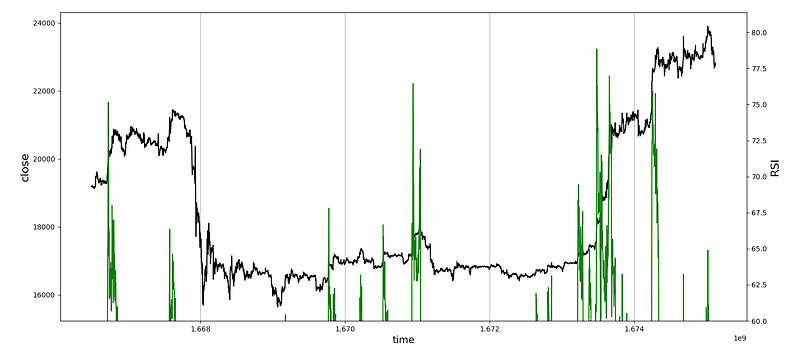
And it looks like RSI(length=50) is able to catch the price jumps, as soon it crosses 60. That makes a good entry point. But what is about the right time to sell? Ideally I would prefer to sell when the price trend has stabilised. Let’s see how RSI with under 50 correlates with price stabilsation.
# Secondary chart for RSI indicator
ax2 = ax.twinx()
ax2.plot(trading_data[coin_for_plotting].close_time,
         trading_data[coin_for_plotting].rsi,
         color='green')
ax2.set_ylabel('RSI', color='black', fontsize=16)
ax2.set_ylim(bottom=60)

# Third chart for RSI indicator
ax3 = ax.twinx()
ax3.plot(trading_data[coin_for_plotting].close_time,
         trading_data[coin_for_plotting].rsi,
         color='red')
ax3.set_ylim(top=50)
ax3.spines.right.set_position(("axes", 1.2))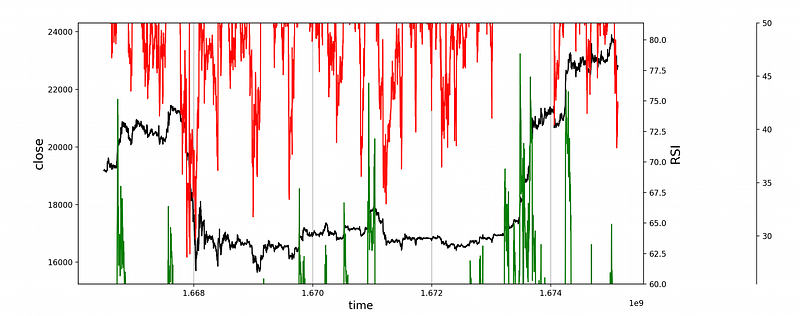
That looks promising, let’s create a trading simulation based on the following criteria:
- BUY signal: 30m chart, RSI(length=50), RSI raises over 60
- SELL signal: 30m chart, RSI(length=50), RSI drops below 50
# Generate trading Signals
for coin in top_coins:
    try:
        trading_data[coin].loc[(trading_data[coin]['rsi'] > 60) & (trading_data[coin]['rsi'].shift() < 60), 'trading_signal'] = 'BUY'
        trading_data[coin].loc[(trading_data[coin]['rsi'] < 50) & (trading_data[coin]['rsi'].shift() > 50), 'trading_signal'] = 'SELL'
    except:
        continue

    purchase_price = 0
    profit_list = []
    for i in range(len(trading_data[coin])):
        if trading_data[coin].iloc[i]['trading_signal'] == 'BUY':
            purchase_price = trading_data[coin].iloc[i]['close']

        if trading_data[coin].iloc[i]['trading_signal'] == 'SELL' and purchase_price != 0:
            profit = round(((trading_data[coin].iloc[i]['close'] / purchase_price) * 100)-100, 2)
            profit_list.append(profit)
            purchase_price = 0

    print(coin, 'Total Profit:', round(sum(profit_list),2), profit_list)
and here is the output of simulated trades:
BTCUSDT Total Profit: -8.9 [-2.34, -0.9, -0.48, -1.4, -1.74, -0.9, 1.17, -0.44, -0.67, -1.42, 4.99, -2.83, -1.94]
ETHUSDT Total Profit: -30.41 [-1.76, -3.53, -2.5, -2.66, -3.17, -1.81, -0.22, -2.86, -1.98, -1.45, -0.22, 1.47, -1.35, -2.37, -2.74, -3.26]
BNBUSDT Total Profit: -33.74 [-2.29, -3.74, -3.39, -10.91, -2.15, -1.03, -1.12, 1.3, -2.38, -3.26, -2.55, -2.22]
XRPUSDT Total Profit: -36.08 [-3.19, -2.75, -4.25, -2.64, -2.89, -2.07, -2.93, -3.0, -1.93, -0.83, 0.39, -4.86, -2.49, -2.64]
ADAUSDT Total Profit: -24.77 [-2.17, -3.57, -4.66, -2.23, -1.97, -2.35, -1.8, -1.4, -2.15, -1.8, 11.06, -0.52, -3.52, -4.14, -3.55]
DOGEUSDT Total Profit: -64.96 [-8.6, -8.43, -7.59, -4.65, -1.45, -5.03, -5.39, -1.13, -2.1, -3.25, 0.99, -3.83, 0.78, -5.47, -2.7, -3.16, -3.95]
MATICUSDT Total Profit: -42.23 [-2.46, -3.53, -7.98, -3.32, -2.89, -1.76, -2.7, -1.66, -1.38, -2.34, -0.26, 1.6, -4.92, -3.14, -5.49]
SOLUSDT Total Profit: 16.88 [-4.3, -2.49, -5.27, -3.07, -2.35, -1.9, 17.68, -4.52, -5.44, 30.31, 5.41, -7.18]
DOTUSDT Total Profit: -26.12 [-2.6, -1.35, -3.73, -5.44, -2.92, -2.47, -2.1, -1.6, -0.99, -1.8, 1.97, 7.25, -3.44, -3.24, -3.66]
LTCUSDT Total Profit: -27.53 [-1.93, 1.3, -3.74, -4.79, -1.67, -4.95, 0.67, -2.61, 3.16, -2.55, -2.99, -1.85, -3.71, 0.49, -2.59, 0.23]
SHIBUSDT Total Profit: -65.66 [-2.29, -6.4, -1.22, -2.66, -3.75, -3.28, -1.94, -4.66, -1.33, -3.24, -4.95, -5.21, -5.03, 0.5, -5.31, -6.68, -3.8, -4.41]
AVAXUSDT Total Profit: -51.51 [-3.49, -1.14, -2.33, -5.78, -1.84, -2.9, -3.28, -2.49, -3.65, -0.25, -6.08, -3.76, -5.97, -4.12, -4.43]
TRXUSDT Total Profit: -14.72 [-2.0, -1.71, -1.96, -2.04, -1.09, -0.87, -1.39, -1.52, -1.13, -0.47, -2.23, 5.05, -1.83, -1.53]
UNIUSDT Total Profit: -23.52 [-4.49, -2.6, 0.33, -3.1, -2.11, -1.85, -1.81, 0.49, 2.17, -7.15, -3.4]
ATOMUSDT Total Profit: -24.16 [-2.28, -4.28, -3.18, -1.82, -1.29, -1.64, -2.04, -2.49, 5.97, -4.93, 1.36, -4.49, -3.05]
LINKUSDT Total Profit: -38.94 [0.1, -5.84, -4.86, -7.33, -4.04, -4.2, -3.36, -1.17, -2.97, -2.66, 1.18, 0.49, -4.28]
ETCUSDT Total Profit: -32.98 [-2.92, -3.61, -3.11, -0.05, -3.55, -3.2, -2.39, -1.09, -2.83, -1.91, 10.18, -4.23, -4.85, 0.09, -0.68, -3.63, -5.2]
XMRUSDT Total Profit: -20.66 [-2.4, 1.03, -2.1, -0.73, -1.36, -1.58, -2.18, -1.83, -1.68, -3.63, 0.41, -3.48, -1.13]
APTUSDT Total Profit: -12.15 [-5.46, -8.65, -5.45, -2.6, -3.97, -4.03, 26.27, -10.14, -4.55, 3.88, 10.66, -8.11]
As you can see my theory of buying at RSI 60 and selling at RSI 50 is not doing that well… let adjust the selling point to RSI 55:
Here is the output:
BTCUSDT Total Profit: -3.6 [-0.93, -0.57, -1.04, -0.76, -0.73, -0.94, -0.53, 2.09, -0.22, -0.48, 0.78, 0.1, -1.52, -1.1, 5.9, -2.8, -0.85]
ETHUSDT Total Profit: -23.74 [-0.82, -1.76, -1.71, -1.51, -1.56, -1.85, -0.75, 0.06, -1.21, -0.99, -0.85, -0.07, 1.65, -0.68, -0.74, -0.81, -1.72, -1.2, -2.66, -1.33, -1.94, -1.29]
BNBUSDT Total Profit: -20.21 [-1.4, -0.92, -1.43, -1.69, -1.72, -7.91, -1.43, -1.11, -0.48, -0.85, -0.99, 2.93, -0.18, 3.14, -1.63, -1.68, -1.42, -1.44]
XRPUSDT Total Profit: -32.79 [-2.44, -2.27, -1.57, -3.72, -3.21, -1.4, -1.56, -2.55, -1.64, -1.51, -2.18, -1.13, -1.1, 1.3, -2.76, -2.27, -2.78]
ADAUSDT Total Profit: -18.46 [-1.07, -1.73, -3.31, -2.38, -1.56, -0.65, -1.27, -1.03, -0.83, -1.39, -1.29, -1.82, -1.24, -1.47, 10.6, -1.4, 0.87, -0.81, -2.34, -2.59, -1.75]
DOGEUSDT Total Profit: -39.94 [-7.33, -2.97, -2.35, -2.09, -2.01, 1.15, -2.77, -3.26, -2.17, -0.6, -1.01, -1.91, 0.95, -1.78, 0.87, -2.47, -5.47, -0.37, -2.24, -2.11]
MATICUSDT Total Profit: -32.68 [-1.44, -2.3, -0.76, -5.03, -2.03, -2.51, -1.94, -1.18, -1.01, -1.63, -0.93, -0.78, -1.38, 0.23, -1.09, -1.21, 4.01, -5.43, -1.87, -1.56, -2.84]
SOLUSDT Total Profit: 14.05 [-1.33, -1.96, -1.17, -2.73, -3.49, -4.27, -3.53, -3.13, -0.93, -3.34, -0.28, 17.68, -5.01, -2.96, 25.3, 7.99, -2.79]
DOTUSDT Total Profit: -14.07 [-1.07, -1.05, 0.87, -2.49, -3.95, -2.19, -1.41, -1.4, -1.88, -0.51, -0.93, -0.94, 2.64, -0.51, 9.37, -2.36, -1.66, -2.74, -1.86]
LTCUSDT Total Profit: -20.24 [-0.8, 2.06, -0.1, -4.23, -3.19, -2.08, -2.16, -3.95, 1.9, -2.74, 4.26, 0.32, -0.98, -1.22, -1.27, -0.81, -1.91, -2.19, -2.38, 1.19, -2.43, 2.47]
SHIBUSDT Total Profit: -43.41 [-2.9, -0.27, -2.97, -2.32, -2.66, -2.6, -1.74, -1.94, -2.27, -1.08, -2.08, -1.57, -2.53, -3.3, -2.94, -3.26, 2.61, -2.38, -1.44, -2.67, -3.1]
AVAXUSDT Total Profit: -42.24 [-1.11, -1.94, -0.49, -1.29, -1.92, -3.62, -2.49, -0.61, -1.04, -1.31, -1.06, -1.64, -0.98, -1.14, -0.91, -1.99, -2.33, -4.17, 3.01, -3.59, -2.39, -4.27, -2.19, -2.77]
TRXUSDT Total Profit: -11.13 [-1.0, -1.04, -0.95, -0.93, -1.63, -0.72, -1.09, -0.88, -0.76, -0.65, -0.51, -1.38, -1.08, -0.88, -0.59, 4.64, -1.13, -0.55]
UNIUSDT Total Profit: -25.43 [-3.37, -2.21, -1.74, -2.21, -1.66, 2.13, -2.57, -1.24, -1.08, -0.87, -1.22, 1.8, -2.47, 3.69, -7.15, -2.19, -3.07]
ATOMUSDT Total Profit: -24.48 [-1.35, -1.62, -1.75, -0.38, -4.5, -2.33, -2.89, -2.37, -1.75, -0.23, -1.15, -1.23, 1.68, -1.4, 5.24, -1.8, -2.49, -0.98, -2.93, 3.94, -2.68, -1.51]
LINKUSDT Total Profit: -32.26 [-1.34, 1.92, -1.8, -3.47, -2.4, -0.16, -2.67, -2.44, -3.22, -2.11, -2.28, -1.7, -1.67, -2.76, -2.98, -0.83, 1.63, -1.88, -1.42, 0.33, 2.3, -3.31]
ETCUSDT Total Profit: -19.55 [-2.22, -2.22, -2.52, -1.32, -2.43, -2.34, 1.06, -2.11, -1.97, -1.45, -0.42, -0.84, -1.05, 12.56, -1.63, -2.35, -3.86, -2.1, 1.6, -0.05, -2.16, -1.73]
XMRUSDT Total Profit: -18.92 [-1.2, -1.36, 1.61, -1.26, -1.25, -1.08, -1.08, -0.74, -0.6, -0.75, -0.86, -1.41, -1.2, -1.31, -1.17, 0.06, -1.58, 1.69, -0.23, -2.32, -1.64, -1.24]
APTUSDT Total Profit: 9.67 [-2.87, -6.27, -2.37, -1.33, -1.46, -2.25, -2.37, -0.77, -0.4, -0.45, 32.19, -4.95, -4.52, 4.41, 11.19, -8.11]
that looks a little bit better but still not profitable (too many losses) Perhaps we need to change BUY signal to 65 and SELL signal to 60
# Generate trading Signals
for coin in top_coins:
    try:
        trading_data[coin].loc[(trading_data[coin]['rsi'] > 65) & (trading_data[coin]['rsi'].shift() < 65), 'trading_signal'] = 'BUY'
        trading_data[coin].loc[(trading_data[coin]['rsi'] < 60) & (trading_data[coin]['rsi'].shift() > 60), 'trading_signal'] = 'SELL'
    except:
        continue

    purchase_price = 0
    profit_list = []
    for i in range(len(trading_data[coin])):
        if trading_data[coin].iloc[i]['trading_signal'] == 'BUY':
            purchase_price = trading_data[coin].iloc[i]['close']

        if trading_data[coin].iloc[i]['trading_signal'] == 'SELL' and purchase_price != 0:
            profit = round(((trading_data[coin].iloc[i]['close'] / purchase_price) * 100)-100, 2)
            profit_list.append(profit)
            purchase_price = 0

    print(coin, 'Total Profit:', round(sum(profit_list),2), profit_list)
BTCUSDT Total Profit: -8.12 [-0.66, -1.42, -1.01, -0.27, -0.3, -0.46, -1.57, -0.69, -1.74]
ETHUSDT Total Profit: -6.54 [-0.82, -2.14, -1.09, -1.04, -2.24, -0.22, 1.9, -1.49, 2.32, -1.72]
BNBUSDT Total Profit: -12.14 [-1.31, -0.94, -1.24, -1.61, -1.92, -0.98, -0.43, -0.94, -1.31, -1.25, 1.37, -1.58]
XRPUSDT Total Profit: -4.03 [-1.36, 1.01, -0.89, -2.79]
ADAUSDT Total Profit: -2.92 [5.69, -1.3, -1.63, -5.0, -0.68]
DOGEUSDT Total Profit: -3.9 [10.31, -4.67, 12.36, -6.82, -4.48, -2.43, -3.49, -0.36, -2.51, -1.81]
MATICUSDT Total Profit: -16.12 [-1.29, -2.3, -2.41, -7.42, -0.2, -0.89, -1.24, 2.44, -0.89, -1.92]
SOLUSDT Total Profit: -20.44 [2.22, -1.9, -3.66, -2.27, -0.69, -1.86, -2.12, -2.1, -5.96, -0.2, -1.9]
DOTUSDT Total Profit: -2.81 [5.04, -0.84, -0.71, -1.45, -1.27, -3.08, -0.5]
LTCUSDT Total Profit: -12.39 [-1.31, -4.98, -1.62, -0.21, -1.87, -0.69, -1.23, 1.7, 2.71, -1.88, -1.27, -1.74]
SHIBUSDT Total Profit: -23.68 [-1.83, -0.27, -3.15, -6.42, -1.62, -2.17, -1.23, -5.55, -1.44]
AVAXUSDT Total Profit: -6.56 [-1.67, -1.45, -3.69, -1.31, -1.68, 6.81, -5.42, -1.14, 2.99]
TRXUSDT Total Profit: 1.11 [-0.89, -0.15, -0.71, -0.58, -0.98, 4.9, -0.48]
UNIUSDT Total Profit: -11.43 [-2.07, -2.79, -1.89, -1.1, -0.98, -1.13, -1.27, 1.49, -1.69]
ATOMUSDT Total Profit: -6.21 [0.48, -1.26, -0.82, -0.82, 3.21, -0.38, -6.57, -0.05]
LINKUSDT Total Profit: -5.47 [-1.59, -1.6, 0.33, -2.08, -0.53]
ETCUSDT Total Profit: -15.28 [0.6, -3.01, -3.87, -1.91, -4.17, -2.92]
XMRUSDT Total Profit: -6.11 [-0.56, -0.89, -1.41, 0.17, -3.42]
APTUSDT Total Profit: 21.49 [-1.94, -1.78, 1.3, -2.25, 3.15, -3.12, -3.21, 32.3, 1.89, -4.85]it actually made things worse… how about to go into different direction. Let’s try to set BUY when RSI raise above 40, and SELL when RSI drops below 35 or RSI drops below 55.
And the WINNER is?
# Generate trading Signals
for coin in top_coins:
    try:
        trading_data[coin].loc[(trading_data[coin]['rsi'] > 40) &
                               (trading_data[coin]['rsi'].shift() < 40),
                               'trading_signal'] = 'BUY'

        trading_data[coin].loc[((trading_data[coin]['rsi'] < 55) &
                               (trading_data[coin]['rsi'].shift() > 55)) |
                               (trading_data[coin]['rsi'] < 35),
                               'trading_signal'] = 'SELL'
    except:
        continue

    purchase_price = 0
    profit_list = []
    for i in range(len(trading_data[coin])):
        if trading_data[coin].iloc[i]['trading_signal'] == 'BUY':
            purchase_price = trading_data[coin].iloc[i]['close']

        if trading_data[coin].iloc[i]['trading_signal'] == 'SELL' and purchase_price != 0:
            profit = round(((trading_data[coin].iloc[i]['close'] / purchase_price) * 100)-100, 2)
            profit_list.append(profit)
            purchase_price = 0le
BTCUSDT Total Profit: 2.27 [-3.87, -7.0, 0.57, 4.31, 0.85, 2.14, 1.09, 1.9, 1.67, 0.61]
ETHUSDT Total Profit: 28.14 [-5.43, -12.66, 12.92, 6.23, 1.86, -2.97, 6.33, 2.41, 2.12, 3.42, 1.83, -4.15, 2.56, 2.34, 1.21, 1.5, 5.9, 2.72]
BNBUSDT Total Profit: 21.13 [8.62, 4.87, -2.91, 3.3, -0.81, 2.23, -1.4, -1.81, -2.27, -4.76, 5.59, 1.45, 4.79, 4.24]
XRPUSDT Total Profit: 14.88 [2.7, -5.86, -5.98, -9.1, 12.74, 3.6, 4.74, -2.23, 3.07, -3.43, 3.17, 1.74, -3.74, 3.85, 4.97, 4.64]
ADAUSDT Total Profit: 4.08 [-8.37, -8.6, 3.95, 3.74, 2.81, 1.65, -1.5, 2.74, -4.84, -4.54, 2.16, -2.7, 2.65, 11.29, 3.64]
DOGEUSDT Total Profit: -13.38 [-8.02, -15.81, 20.27, -3.3, -5.03, 3.91, -3.06, 4.06, -4.24, -6.66, 2.77, -2.77, -3.71, 3.93, 4.28]
MATICUSDT Total Profit: 52.56 [4.61, 27.02, 6.47, 5.67, 2.29, -1.9, 2.41, -3.0, 3.57, -3.97, 2.95, 3.24, 3.2]
SOLUSDT Total Profit: -7.87 [6.49, -11.19, -23.59, -19.02, 14.63, 3.79, 3.67, -3.58, 4.61, -4.31, -4.96, -4.82, 9.17, 15.56, 5.68]
DOTUSDT Total Profit: 25.87 [10.08, 5.37, -2.57, 5.7, 2.71, 2.46, 2.96, -6.76, -3.07, 1.52, 1.54, 5.93]
LTCUSDT Total Profit: 17.77 [-13.61, -9.48, 14.04, 3.68, 7.28, 3.62, 2.84, -4.91, 4.78, 2.14, 5.28, 2.11]
SHIBUSDT Total Profit: -15.27 [-7.18, -14.79, -10.77, 7.37, -3.64, 5.16, 2.09, -4.3, 3.65, -3.87, 5.52, -1.73, 2.4, 4.82]
AVAXUSDT Total Profit: 33.83 [4.2, -8.81, -11.68, 15.24, 5.39, 3.17, 7.84, 2.92, 1.28, 2.75, 2.26, -2.01, -3.24, 4.12, 2.29, 8.11]
TRXUSDT Total Profit: 19.15 [-5.6, 6.2, -5.43, 2.16, 3.94, 0.75, -1.41, 5.31, 3.24, 1.45, -1.75, 2.64, 4.66, 2.99]
UNIUSDT Total Profit: 28.74 [-15.22, 18.96, -4.21, 7.3, 5.19, 3.01, -2.68, 4.12, -6.67, 4.42, 2.4, 2.54, 3.23, 6.35]
ATOMUSDT Total Profit: 7.59 [-9.95, -13.28, -10.52, 17.49, -7.08, 5.6, -4.01, 8.58, 3.85, 2.61, 4.51, -4.23, 2.63, 4.44, 6.95]
LINKUSDT Total Profit: 40.94 [8.86, 5.73, -4.69, 5.61, 9.32, 3.88, -3.94, -2.61, 4.07, -3.7, 4.58, 3.04, 7.27, 3.52]
ETCUSDT Total Profit: 46.8 [11.44, 9.72, -11.39, -9.9, 15.29, -3.81, 8.55, 5.51, 1.55, 1.92, 5.1, -4.01, -3.77, 7.31, -2.42, 4.5, 6.35, 4.86]
XMRUSDT Total Profit: 10.88 [-7.08, -11.94, 5.2, 5.07, 2.69, 2.83, -2.37, 2.33, 9.16, 4.99]
APTUSDT Total Profit: 15.19 [7.88, 0.45, 1.91, -8.66, -15.15, 25.61, 4.49, -6.33, 7.27, 6.3, -0.07, -3.83, 5.16, -7.56, -5.9, -2.88, -5.11, 6.09, 5.52]Wow, that looks like a WINNER to me. And I think with a little bit more fine tuning I could get more profit out of it.
Long Term Testing
How about testing these input parameters not just for the last 100 days, but for the last 500 days? Will this trading strategy stand against the test of time and still be profitable?
Output:
BTCUSDT Total Profit: 112.64 [-2.93, 4.67, 3.82, 3.52, 3.48, 2.97, 5.49, 4.33, 3.02, 4.18, 2.54, -2.69, 2.93, 1.79, -2.72, 3.63, 3.91, 2.17, -4.79, -5.8, 8.81, 3.24, -2.72, 5.38, 6.85, -2.66, 7.97, 2.28, -2.12, 2.85, -0.43, -2.44, 3.81, 3.6, 4.16, 4.69, 2.49, -3.08, -3.24, -5.88, 7.87, 1.81, 2.94, 2.52, -3.98, -5.42, -6.06, 4.97, -4.26, 5.87, -3.09, 4.99, 12.42, 2.93, 2.48, -2.74, 1.97, 14.06, 3.26, -3.31, 0.76, -2.83, 3.49, 2.64, -3.87, -7.0, 0.57, 4.31, 0.85, 2.14, 1.09, 1.9, 1.67, 0.61]
ETHUSDT Total Profit: 166.89 [-2.85, -5.74, 8.7, 5.18, 9.36, 4.62, 2.3, 5.65, 4.98, 7.49, -4.32, 8.7, 4.53, 7.72, 6.11, -2.77, 3.71, -4.51, -4.89, -5.63, 6.37, 4.37, -4.06, 13.14, 7.14, -4.97, 3.47, 9.61, -4.24, 8.65, 2.62, 6.96, -3.95, 3.06, -2.66, 3.8, 3.58, -1.85, 4.07, 3.92, 2.98, -3.69, -3.81, -11.08, 8.34, 5.61, -5.3, 9.81, 2.72, 4.79, -3.34, -6.86, -8.87, -5.89, 11.42, -4.02, 0.61, -4.04, -3.99, 6.88, 5.59, 5.31, 5.53, 4.9, 5.61, -7.52, -0.27, 9.75, 4.59, -3.06, 5.53, 3.15, -5.43, -12.66, 12.92, 6.23, 1.86, -2.97, 6.33, 2.41, 2.12, 3.42, 1.83, -4.15, 2.56, 2.34, 1.21, 1.5, 5.9, 2.72]
BNBUSDT Total Profit: 167.33 [2.51, 4.93, 26.11, 6.93, 4.39, 5.3, 5.59, -5.77, 7.96, 6.85, -6.72, 6.52, 6.08, 2.81, 1.7, -2.99, -3.9, -4.29, -4.83, 4.77, 3.48, -5.86, -3.94, -3.89, 10.47, 3.32, 4.0, 7.12, -4.56, 6.39, 10.21, 4.97, 2.23, 6.97, -3.67, 4.27, -2.79, 3.01, -2.15, 3.54, 3.42, 2.11, -6.74, -12.55, 18.79, 5.01, 2.93, -3.48, 3.92, -3.2, -3.99, -8.5, 13.6, -4.7, 7.95, -4.39, 6.11, 5.1, 4.02, 0.53, -4.45, 4.43, 2.67, 2.72, 4.54, -0.57, -3.36, 3.59, 3.11, -3.66, 2.15, 2.02, 8.62, 4.87, -2.91, 3.3, -0.81, 2.23, -1.4, -1.81, -2.27, -4.76, 5.59, 1.45, 4.79, 4.24]
XRPUSDT Total Profit: 105.08 [-3.0, 7.92, 5.16, 2.02, 9.58, -5.13, 5.13, 1.73, 6.16, 4.93, 4.9, -2.74, -4.12, 4.5, 5.33, 3.45, -3.72, -5.44, 10.21, 4.91, 7.9, 5.22, -9.16, 16.09, 5.53, -3.78, 3.81, -2.56, 4.34, 4.39, -3.0, 4.66, -3.27, -2.69, -5.59, 3.79, -6.15, -17.12, -21.44, -15.27, 20.16, 2.03, 2.74, -4.82, -8.98, 9.1, 4.9, -5.96, 1.62, 7.85, 6.88, 3.56, -5.23, 3.04, 3.59, 5.08, 3.3, 10.84, 7.09, -3.46, 5.68, 3.71, 2.7, -5.86, -5.98, -9.1, 12.74, 3.6, 4.74, -2.23, 3.07, -3.43, 3.17, 1.74, -3.74, 3.85, 4.97, 4.64]
ADAUSDT Total Profit: 124.56 [-3.47, 5.63, 6.56, 6.53, 3.31, 5.29, 2.69, 1.42, -6.26, 5.91, -4.98, -4.37, -8.11, 9.11, -17.82, 6.22, 9.26, 6.57, 4.57, 5.08, 5.89, -6.79, 9.84, 1.13, -4.37, -9.3, 6.84, 15.01, 5.79, 5.97, 3.21, -3.58, 4.57, -4.0, 5.13, -4.77, 4.03, -5.61, -20.47, 23.45, 4.55, -4.18, 2.33, -8.18, 10.86, 6.33, 3.93, 6.77, 8.61, 3.23, 3.15, -4.0, 5.4, 5.07, 4.8, 1.71, 3.69, -0.14, -2.28, -3.15, 1.82, 5.05, -8.37, -8.6, 3.95, 3.74, 2.81, 1.65, -1.5, 2.74, -4.84, -4.54, 2.16, -2.7, 2.65, 11.29, 3.64]
DOGEUSDT Total Profit: 128.32 [-3.85, 9.3, 1.24, 6.14, 23.95, 3.37, 3.8, -5.09, 2.36, 10.61, 6.47, -7.35, 6.51, 14.19, 4.93, 3.26, -7.18, 7.03, -5.91, 5.39, 7.41, 5.51, 4.2, 4.51, -4.4, 9.99, 3.06, -1.79, 6.3, 5.25, -3.59, 4.04, -3.93, 18.66, 3.46, -20.68, -15.43, -14.58, 16.6, 2.51, -4.05, 4.46, 3.23, -2.44, -2.55, -9.88, -8.24, 10.56, 7.59, 7.07, -3.45, 3.66, -4.89, 7.73, 5.26, 3.92, 2.17, 4.3, 4.08, 4.71, 4.38, -2.93, -4.72, 5.46, -8.02, -15.81, 20.27, -3.3, -5.03, 3.91, -3.06, 4.06, -4.24, -6.66, 2.77, -2.77, -3.71, 3.93, 4.28]
MATICUSDT Total Profit: 259.09 [-3.3, 9.09, 10.52, 10.26, 4.59, 4.11, -5.35, 8.56, 8.09, 16.72, -7.37, 9.26, 4.05, -6.73, -9.75, 8.45, 7.27, 5.22, -8.23, -7.91, 12.06, 7.04, 12.53, 5.86, 10.11, 14.58, 6.36, 2.73, 7.31, -4.71, 0.95, -3.96, 5.88, -2.83, 4.73, -2.67, -3.86, -7.95, -3.58, 1.55, -4.71, 14.05, 23.09, 5.05, 11.45, 3.61, -10.62, -7.48, 11.54, -16.96, 7.86, 7.95, 7.33, 3.68, -5.89, 7.39, 7.23, 8.4, -3.54, 1.84, -4.06, 8.15, 11.49, 4.61, 27.02, 6.47, 5.67, 2.29, -1.9, 2.41, -3.0, 3.57, -3.97, 2.95, 3.24, 3.2]
SOLUSDT Total Profit: 106.9 [-7.8, 13.1, 6.22, 7.7, 5.43, 3.56, -10.04, 8.85, -6.13, 4.85, -12.76, 5.38, 4.22, 7.26, 6.04, 3.13, -3.49, -6.16, 6.24, 4.56, -6.12, -8.13, 15.46, 9.84, -6.88, 9.53, 4.81, 10.4, 10.95, 6.13, 3.66, 4.32, -6.83, 7.28, 5.63, 5.22, -6.79, 4.7, -11.57, -25.09, -22.08, 25.34, 6.8, -5.19, 4.82, -5.65, 5.96, -12.87, 14.93, 6.22, -4.17, 6.79, 12.3, 3.74, -6.97, 5.06, 5.92, 0.09, 4.0, -3.88, 5.52, -2.98, 4.39, 6.49, -11.19, -23.59, -19.02, 14.63, 3.79, 3.67, -3.58, 4.61, -4.31, -4.96, -4.82, 9.17, 15.56, 5.68]
DOTUSDT Total Profit: 251.53 [15.12, 3.95, 9.01, 7.32, -5.78, 6.18, 8.38, -6.93, 10.86, 8.24, 9.83, 4.55, 5.75, 13.61, 4.24, -9.68, 14.31, 6.33, 5.23, -7.75, 2.45, 2.66, 22.78, -4.75, 4.4, 6.31, -5.19, 3.29, -6.24, 4.84, -2.81, 6.53, 3.62, -3.51, 2.2, -8.33, -24.24, 31.42, 5.94, -4.9, 14.09, 3.85, 3.0, -5.88, -8.65, 17.3, 9.76, 1.78, 9.21, 19.85, 7.2, 1.35, -5.83, 5.6, 2.87, 10.68, -0.42, -4.44, 1.75, -3.28, 5.43, 1.2, 10.08, 5.37, -2.57, 5.7, 2.71, 2.46, 2.96, -6.76, -3.07, 1.52, 1.54, 5.93]
LTCUSDT Total Profit: 156.61 [-4.43, 7.59, 0.27, 5.25, -7.13, 9.89, 6.66, -4.62, 9.31, 5.21, 3.23, -3.35, 3.07, -4.01, 5.38, 4.41, 10.87, 4.7, -3.51, -9.33, 6.52, 14.49, 7.16, 3.24, 4.69, 2.77, -3.74, 0.62, -3.5, 6.2, -2.67, 4.21, -4.36, 3.64, 3.3, -8.52, -10.85, 9.72, -3.61, 3.65, 2.74, 3.92, -6.98, -5.21, -6.31, 12.47, 7.32, 6.49, 4.51, 18.26, 4.06, 4.33, -4.8, 5.95, 3.86, 5.37, 4.43, 4.42, 2.78, -2.27, -3.62, 4.7, -13.61, -9.48, 14.04, 3.68, 7.28, 3.62, 2.84, -4.91, 4.78, 2.14, 5.28, 2.11]
SHIBUSDT Total Profit: 144.35 [-3.64, 3.78, 8.16, 7.66, -11.33, -17.91, 25.6, 12.9, -11.89, 14.5, 14.83, 4.7, 2.1, -3.97, -2.64, 7.22, -2.84, -7.42, -6.29, -7.73, 15.78, 4.47, -4.84, -10.67, 15.25, 5.77, 8.42, -4.7, 8.9, 13.24, 6.13, 2.76, 3.67, 6.9, 4.16, -3.15, 13.0, -3.49, 4.38, 4.47, -8.03, 1.85, -6.94, -20.51, 29.67, 6.3, 3.77, 3.79, -4.36, -6.23, 10.82, 7.35, 4.4, 4.85, -4.81, 8.42, -5.17, 7.49, 6.43, 8.43, -6.9, 2.13, -3.26, -2.49, 4.66, 1.72, -7.18, -14.79, -10.77, 7.37, -3.64, 5.16, 2.09, -4.3, 3.65, -3.87, 5.52, -1.73, 2.4, 4.82]
AVAXUSDT Total Profit: 193.86 [19.01, 10.26, -4.53, 6.91, 4.14, 15.93, 10.01, -18.15, 14.5, 10.99, 7.58, 5.92, -4.98, -7.5, -8.73, 7.98, 6.13, 4.02, -6.84, 15.79, 7.78, 7.51, 19.41, -7.92, 10.66, 13.65, 4.35, 4.93, -5.95, -4.62, 6.52, 4.69, -3.07, -3.16, 4.79, -3.28, -4.39, 2.51, -8.4, -27.19, 23.2, 9.17, -12.95, -8.87, 12.6, 7.15, -7.3, -13.55, 12.01, 9.03, 1.84, -5.55, 7.65, -6.44, 11.95, -5.82, 6.15, -4.09, -6.27, 8.52, 11.35, -5.33, 2.75, 1.61, -5.24, 5.83, 3.37, 4.2, -8.81, -11.68, 15.24, 5.39, 3.17, 7.84, 2.92, 1.28, 2.75, 2.26, -2.01, -3.24, 4.12, 2.29, 8.11]
TRXUSDT Total Profit: 82.49 [-4.36, -7.06, 4.6, 1.28, 3.96, 5.49, 3.08, 7.27, -4.99, 4.37, -4.31, 7.51, 4.98, -4.69, 3.8, -4.93, 3.03, -3.42, -4.57, -6.3, 7.61, -5.35, 8.02, -3.22, 2.41, 4.71, 6.14, 7.24, 3.82, 3.25, -4.0, -2.36, -3.17, 3.67, 4.63, 3.8, 6.66, 4.12, -7.99, -10.79, -11.75, -10.45, 18.63, 4.4, 4.08, -2.17, 2.86, -2.53, 2.82, 2.15, 1.74, 1.94, 5.67, 1.96, 1.02, 6.38, 2.65, -5.6, 6.2, -5.43, 2.16, 3.94, 0.75, -1.41, 5.31, 3.24, 1.45, -1.75, 2.64, 4.66, 2.99]
UNIUSDT Total Profit: 215.34 [-3.53, -8.64, 22.06, 5.19, 2.81, 6.88, -6.82, 4.91, 9.1, 5.92, 7.33, 6.96, 6.6, 9.14, -8.94, 6.4, 4.89, -6.49, -8.33, 11.09, 7.15, -7.89, 6.15, -5.44, 8.46, 14.07, -4.75, 10.51, 4.6, 5.03, 5.38, -3.87, 4.98, -5.1, -3.76, -3.72, -11.51, 5.15, -8.5, -16.24, 16.99, 10.61, 0.19, -5.23, -12.68, -7.58, 19.48, 11.9, 6.41, 22.2, 37.08, 9.3, -9.44, 5.58, 6.56, 10.24, -10.21, 2.95, -4.79, 6.62, 3.19, -15.22, 18.96, -4.21, 7.3, 5.19, 3.01, -2.68, 4.12, -6.67, 4.42, 2.4, 2.54, 3.23, 6.35]
ATOMUSDT Total Profit: 303.92 [22.06, 8.16, 10.64, 8.55, 6.41, 5.4, 5.09, 9.33, 10.04, 8.49, 10.95, 7.14, 10.79, 6.17, 11.04, 9.33, -14.57, 18.8, 8.45, 6.65, -10.85, 6.97, 10.02, 14.52, 9.65, 5.16, 5.92, 5.24, -3.2, 5.02, -3.08, -5.23, -5.31, 2.82, -9.73, -7.52, -19.38, 11.47, 10.86, 5.18, -8.88, -8.15, -8.57, 11.74, 12.39, 6.1, 9.43, 22.89, 10.98, 2.88, 5.35, 8.3, 8.41, 10.18, 6.95, 4.16, -6.47, 6.33, 4.86, -9.95, -13.28, -10.52, 17.49, -7.08, 5.6, -4.01, 8.58, 3.85, 2.61, 4.51, -4.23, 2.63, 4.44, 6.95]
LINKUSDT Total Profit: 241.59 [-3.41, 13.26, 7.12, 5.23, 8.38, 6.52, 6.39, 6.53, 2.9, -6.64, 11.7, 8.16, 9.9, 7.74, 6.62, -6.51, -11.11, -8.39, 13.42, 12.8, -6.71, 6.45, 7.66, 13.84, -5.88, 9.52, 5.19, -4.96, 1.75, -4.16, 4.97, 5.63, -3.23, -2.82, -3.17, 8.2, -5.46, -15.25, 19.27, 4.64, 1.53, -10.81, 16.75, 17.35, 4.64, 4.51, 5.2, 8.89, 7.33, -6.74, -4.23, 5.31, 4.93, 5.25, 5.85, -5.62, 3.72, 4.21, 2.37, -5.02, 4.7, 4.44, 8.86, 5.73, -4.69, 5.61, 9.32, 3.88, -3.94, -2.61, 4.07, -3.7, 4.58, 3.04, 7.27, 3.52]
ETCUSDT Total Profit: 160.2 [-3.31, -6.3, 6.61, 2.33, 7.92, 7.74, -4.37, 5.55, 4.39, -4.35, 11.02, 7.02, 3.38, -3.77, 3.85, 3.82, -4.89, -5.37, -6.24, 6.43, 3.53, -5.25, -6.93, 9.96, 0.31, 8.3, 12.09, 7.29, 2.44, 5.84, -4.84, 10.53, 3.63, 5.32, -3.66, -5.06, -3.4, 2.58, -14.31, 18.21, 9.7, 5.68, -4.26, -9.33, 9.0, 11.76, 3.12, -3.65, 6.88, 13.62, 5.68, 2.14, -7.68, -6.59, -5.08, 6.87, 7.36, 7.07, -11.26, -2.14, 1.84, -2.75, -4.28, 5.32, 7.78, 9.72, -11.39, -9.9, 15.29, -3.81, 8.55, 5.51, 1.55, 1.92, 5.1, -4.01, -3.77, 7.31, -2.42, 4.5, 6.35, 4.86]
XMRUSDT Total Profit: 145.78 [9.28, 5.16, 2.62, 5.34, 1.86, 1.73, 8.12, 5.69, -4.62, 4.26, -18.15, 2.64, 5.7, 4.88, 4.12, -6.15, 6.86, -10.31, -4.72, -12.66, 6.98, 3.24, 3.3, -3.43, -4.82, 7.35, 9.62, 5.53, 5.45, 7.28, 7.11, 8.02, -12.32, 18.08, 10.97, 6.46, 5.48, -6.98, -5.84, -7.14, -16.83, 10.65, 3.98, 5.59, 11.69, 4.57, 7.48, 5.0, 4.87, -4.2, -4.83, 5.79, 3.34, 4.9, -3.99, 1.97, -3.04, 6.27, 5.03, 3.18, 3.65, 3.84, -7.08, -11.94, 5.2, 5.07, 2.69, 2.83, -2.37, 2.33, 9.16, 4.99]
APTUSDT Total Profit: 7.31 [0.45, 1.91, -8.66, -15.15, 25.61, 4.49, -6.33, 7.27, 6.3, -0.07, -3.83, 5.16, -7.56, -5.9, -2.88, -5.11, 6.09, 5.52]

Overall Average Profit: 161.78  Parameters: 40 55 35 [112.64, 166.89, 167.33, 105.08, 124.56, 128.32, 259.09, 106.9, 251.53, 156.61, 144.35, 193.86, 82.49, 215.34, 303.92, 241.59, 160.2, 145.78, 7.31]
Wow, an average Profit of 161% over last 500 days! I’m quite impressed with this strategy!
Important Update!
Oh man… sometimes you need a good night sleep to realise the mistake in the code… Forget the profit calculation I’ve shown above, I had a calculation error in my BUY command.
here is my updated code:
import pandas as pd
import matplotlib.pyplot as plt   # needs pip install
import time
import pandas_ta as pta
from binance.client import Client


api_key = "YOUR_BINANCE_API_KEY"
api_secret = "YOUR_BINANCE_API_SECRET"


client = Client(api_key, api_secret)

def get_data_frame(symbol='BTCUSDT', period='30m', timeframe='1 hours ago UTC'):
    try:
        bars = client.get_historical_klines(symbol, period, timeframe)
    except Exception as e:
        print('GET Data error', symbol)
        print(e)
        time.sleep(5)
        bars = client.get_historical_klines(symbol, period, timeframe)

    for line in bars:
        del line[7:]

    df = pd.DataFrame(bars, columns=['open_time', 'open',
                                     'high', 'low', 'close',
                                     'volume', 'close_time'])
    df['close'] = df['close'].apply(pd.to_numeric)
    df['open'] = df['open'].apply(pd.to_numeric)
    df['high'] = df['high'].apply(pd.to_numeric)
    df['low'] = df['low'].apply(pd.to_numeric)
    df['volume'] = df['volume'].apply(pd.to_numeric)
    df['close_time'] = df['close_time'].apply(pd.to_numeric) / 1000

    return df


top_coins = ['BTCUSDT', 'ETHUSDT', 'BNBUSDT', 'XRPUSDT',
             'ADAUSDT', 'DOGEUSDT', 'MATICUSDT', 'SOLUSDT',
             'DOTUSDT', 'LTCUSDT', 'SHIBUSDT', 'AVAXUSDT',
             'DAIUSDT', 'TRXUSDT', 'UNIUSDT', 'ATOMUSDT',
             'LINKUSDT', 'ETCUSDT', 'XMRUSDT', 'APTUSDT']

trading_data = {}
for coin in top_coins:
    trading_data[coin] = get_data_frame(symbol=coin, period='30m',
                                        timeframe='100 days ago UTC')

# adding RSI indicator to the trading data set
for coin in top_coins:
    trading_data[coin]['rsi'] = pta.rsi(close=trading_data[coin]['close'], length=50)

# Generate trading Signals

buy_limits = [40, 45, 50, 55, 60, 65]
sell_limits = [70, 75]
loss_stop_limits = [30, 35]

for buy_limit in buy_limits:
    for sell_limit in sell_limits:
        for loss_stop_limit in loss_stop_limits:
            total_profit = []
            total_profit_coin_ref = []
            for coin in top_coins:
                try:
                    trading_data[coin].loc[(trading_data[coin]['rsi'] > buy_limit) &
                                           (trading_data[coin]['rsi'].shift() < buy_limit),
                                           'trading_signal'] = 'BUY'

                    trading_data[coin].loc[((trading_data[coin]['rsi'] < sell_limit) &
                                           (trading_data[coin]['rsi'].shift() > sell_limit)) |
                                           ((trading_data[coin]['rsi'] < loss_stop_limit) &
                                            (trading_data[coin]['rsi'].shift() > loss_stop_limit)),
                                           'trading_signal'] = 'SELL'
                except:
                    continue

                purchase_price = 0
                profit_list = []
                for i in range(len(trading_data[coin])):
                    if trading_data[coin].iloc[i]['trading_signal'] == 'BUY' and purchase_price == 0:
                        purchase_price = trading_data[coin].iloc[i]['close']

                    if trading_data[coin].iloc[i]['trading_signal'] == 'SELL' and purchase_price != 0:
                        profit = round(((trading_data[coin].iloc[i]['close'] / purchase_price) * 100)-100, 2)
                        profit_list.append(profit)
                        purchase_price = 0

                #print(coin, 'Total Profit:', round(sum(profit_list),2), profit_list)
                total_profit.append(round(sum(profit_list),2))
                total_profit_coin_ref.append(f'{coin} {round(sum(profit_list), 2)}%')

            print(f'Overall Average Profit: {round(sum(total_profit)/len(total_profit),2)}%, RSI Parameters: BUY: {buy_limit}, SELL: {sell_limit}, LOSS STOP: {loss_stop_limit},\nDetails: {total_profit_coin_ref}\n')


#
# coin_for_plotting = 'BTCUSDT'
# fig,ax = plt.subplots()
# fig.subplots_adjust(right=0.75)
#
# # Primary chart for Close Price
# ax.set_xlabel('time', fontsize=14)
# ax.plot(trading_data[coin_for_plotting].close_time, trading_data[coin_for_plotting].close, color='black')
# ax.grid(axis="x")
# ax.set_ylabel('close', color='black', fontsize=16)
#
# # Secondary chart for RSI indicator
# ax2 = ax.twinx()
# ax2.plot(trading_data[coin_for_plotting].close_time,
#          trading_data[coin_for_plotting].rsi,
#          color='green')
# ax2.set_ylabel('RSI', color='black', fontsize=16)
# ax2.set_ylim(bottom=60)
#
# # Third chart for RSI indicator
# ax3 = ax.twinx()
# ax3.plot(trading_data[coin_for_plotting].close_time,
#          trading_data[coin_for_plotting].rsi,
#          color='red')
# ax3.set_ylim(top=50)
# ax3.spines.right.set_position(("axes", 1.2))
## plt.show()
Output:
Overall Average Profit: -3.95%, RSI Parameters: BUY: 40, SELL: 70, LOSS STOP: 30,
Details: ['BTCUSDT -2.72%', 'ETHUSDT -3.33%', 'BNBUSDT -31.44%', 'XRPUSDT -20.2%', 'ADAUSDT -13.12%', 'DOGEUSDT -7.68%', 'MATICUSDT 6.62%', 'SOLUSDT -38.38%', 'DOTUSDT -22.53%', 'LTCUSDT 61.0%', 'SHIBUSDT 17.39%', 'AVAXUSDT 23.37%', 'TRXUSDT -0.67%', 'UNIUSDT 3.31%', 'ATOMUSDT -5.22%', 'LINKUSDT -28.86%', 'ETCUSDT -21.36%', 'XMRUSDT 24.48%', 'APTUSDT -15.64%']

Overall Average Profit: -4.02%, RSI Parameters: BUY: 40, SELL: 70, LOSS STOP: 35,
Details: ['BTCUSDT 1.48%', 'ETHUSDT 3.57%', 'BNBUSDT -20.66%', 'XRPUSDT -19.06%', 'ADAUSDT -22.02%', 'DOGEUSDT -1.8%', 'MATICUSDT 17.4%', 'SOLUSDT -38.19%', 'DOTUSDT -26.46%', 'LTCUSDT 57.71%', 'SHIBUSDT 5.21%', 'AVAXUSDT 23.92%', 'TRXUSDT 2.46%', 'UNIUSDT 6.19%', 'ATOMUSDT -23.61%', 'LINKUSDT -28.26%', 'ETCUSDT -24.16%', 'XMRUSDT 20.42%', 'APTUSDT -10.56%']

Overall Average Profit: -3.64%, RSI Parameters: BUY: 40, SELL: 75, LOSS STOP: 30,
Details: ['BTCUSDT 2.87%', 'ETHUSDT 3.57%', 'BNBUSDT -20.78%', 'XRPUSDT -18.72%', 'ADAUSDT -20.06%', 'DOGEUSDT -1.8%', 'MATICUSDT 17.4%', 'SOLUSDT -38.19%', 'DOTUSDT -26.46%', 'LTCUSDT 60.73%', 'SHIBUSDT 7.57%', 'AVAXUSDT 26.11%', 'TRXUSDT 2.46%', 'UNIUSDT 6.19%', 'ATOMUSDT -23.61%', 'LINKUSDT -28.26%', 'ETCUSDT -33.53%', 'XMRUSDT 20.42%', 'APTUSDT -5.01%']

Overall Average Profit: -3.64%, RSI Parameters: BUY: 40, SELL: 75, LOSS STOP: 35,
Details: ['BTCUSDT 2.87%', 'ETHUSDT 3.57%', 'BNBUSDT -20.78%', 'XRPUSDT -18.72%', 'ADAUSDT -20.06%', 'DOGEUSDT -1.8%', 'MATICUSDT 17.4%', 'SOLUSDT -38.19%', 'DOTUSDT -26.46%', 'LTCUSDT 60.73%', 'SHIBUSDT 7.57%', 'AVAXUSDT 26.11%', 'TRXUSDT 2.46%', 'UNIUSDT 6.19%', 'ATOMUSDT -23.61%', 'LINKUSDT -28.26%', 'ETCUSDT -33.53%', 'XMRUSDT 20.42%', 'APTUSDT -5.01%']

Overall Average Profit: 6.77%, RSI Parameters: BUY: 45, SELL: 70, LOSS STOP: 30,
Details: ['BTCUSDT 15.34%', 'ETHUSDT 2.99%', 'BNBUSDT -20.78%', 'XRPUSDT -22.96%', 'ADAUSDT -16.39%', 'DOGEUSDT -3.34%', 'MATICUSDT 6.33%', 'SOLUSDT 19.87%', 'DOTUSDT -28.38%', 'LTCUSDT 68.1%', 'SHIBUSDT 13.22%', 'AVAXUSDT 38.08%', 'TRXUSDT -0.22%', 'UNIUSDT 14.3%', 'ATOMUSDT -8.53%', 'LINKUSDT -15.28%', 'ETCUSDT -9.17%', 'XMRUSDT 18.11%', 'APTUSDT 57.33%']

Overall Average Profit: 6.77%, RSI Parameters: BUY: 45, SELL: 70, LOSS STOP: 35,
Details: ['BTCUSDT 15.34%', 'ETHUSDT 2.99%', 'BNBUSDT -20.78%', 'XRPUSDT -22.96%', 'ADAUSDT -16.39%', 'DOGEUSDT -3.34%', 'MATICUSDT 6.33%', 'SOLUSDT 19.87%', 'DOTUSDT -28.38%', 'LTCUSDT 68.1%', 'SHIBUSDT 13.22%', 'AVAXUSDT 38.08%', 'TRXUSDT -0.22%', 'UNIUSDT 14.3%', 'ATOMUSDT -8.53%', 'LINKUSDT -15.28%', 'ETCUSDT -9.17%', 'XMRUSDT 18.11%', 'APTUSDT 57.33%']

Overall Average Profit: 6.77%, RSI Parameters: BUY: 45, SELL: 75, LOSS STOP: 30,
Details: ['BTCUSDT 15.34%', 'ETHUSDT 2.99%', 'BNBUSDT -20.78%', 'XRPUSDT -22.96%', 'ADAUSDT -16.39%', 'DOGEUSDT -3.34%', 'MATICUSDT 6.33%', 'SOLUSDT 19.87%', 'DOTUSDT -28.38%', 'LTCUSDT 68.1%', 'SHIBUSDT 13.22%', 'AVAXUSDT 38.08%', 'TRXUSDT -0.22%', 'UNIUSDT 14.3%', 'ATOMUSDT -8.53%', 'LINKUSDT -15.28%', 'ETCUSDT -9.17%', 'XMRUSDT 18.11%', 'APTUSDT 57.33%']

Overall Average Profit: 6.77%, RSI Parameters: BUY: 45, SELL: 75, LOSS STOP: 35,
Details: ['BTCUSDT 15.34%', 'ETHUSDT 2.99%', 'BNBUSDT -20.78%', 'XRPUSDT -22.96%', 'ADAUSDT -16.39%', 'DOGEUSDT -3.34%', 'MATICUSDT 6.33%', 'SOLUSDT 19.87%', 'DOTUSDT -28.38%', 'LTCUSDT 68.1%', 'SHIBUSDT 13.22%', 'AVAXUSDT 38.08%', 'TRXUSDT -0.22%', 'UNIUSDT 14.3%', 'ATOMUSDT -8.53%', 'LINKUSDT -15.28%', 'ETCUSDT -9.17%', 'XMRUSDT 18.11%', 'APTUSDT 57.33%']

Overall Average Profit: 17.76%, RSI Parameters: BUY: 50, SELL: 70, LOSS STOP: 30,
Details: ['BTCUSDT 14.39%', 'ETHUSDT 17.93%', 'BNBUSDT 6.11%', 'XRPUSDT -26.03%', 'ADAUSDT -6.31%', 'DOGEUSDT 43.82%', 'MATICUSDT 26.26%', 'SOLUSDT 13.47%', 'DOTUSDT -0.81%', 'LTCUSDT 66.23%', 'SHIBUSDT 25.94%', 'AVAXUSDT 36.59%', 'TRXUSDT -5.64%', 'UNIUSDT 9.91%', 'ATOMUSDT 2.33%', 'LINKUSDT -15.28%', 'ETCUSDT -3.43%', 'XMRUSDT 19.73%', 'APTUSDT 112.32%']

Overall Average Profit: 17.76%, RSI Parameters: BUY: 50, SELL: 70, LOSS STOP: 35,
Details: ['BTCUSDT 14.39%', 'ETHUSDT 17.93%', 'BNBUSDT 6.11%', 'XRPUSDT -26.03%', 'ADAUSDT -6.31%', 'DOGEUSDT 43.82%', 'MATICUSDT 26.26%', 'SOLUSDT 13.47%', 'DOTUSDT -0.81%', 'LTCUSDT 66.23%', 'SHIBUSDT 25.94%', 'AVAXUSDT 36.59%', 'TRXUSDT -5.64%', 'UNIUSDT 9.91%', 'ATOMUSDT 2.33%', 'LINKUSDT -15.28%', 'ETCUSDT -3.43%', 'XMRUSDT 19.73%', 'APTUSDT 112.32%']

Overall Average Profit: 17.76%, MFI Parameters: BUY: 50, SELL: 75, LOSS STOP: 30,
Details: ['BTCUSDT 14.39%', 'ETHUSDT 17.93%', 'BNBUSDT 6.11%', 'XRPUSDT -26.03%', 'ADAUSDT -6.31%', 'DOGEUSDT 43.82%', 'MATICUSDT 26.26%', 'SOLUSDT 13.47%', 'DOTUSDT -0.81%', 'LTCUSDT 66.23%', 'SHIBUSDT 25.94%', 'AVAXUSDT 36.59%', 'TRXUSDT -5.64%', 'UNIUSDT 9.91%', 'ATOMUSDT 2.33%', 'LINKUSDT -15.28%', 'ETCUSDT -3.43%', 'XMRUSDT 19.73%', 'APTUSDT 112.32%']

Overall Average Profit: 17.76%, MFI Parameters: BUY: 50, SELL: 75, LOSS STOP: 35,
Details: ['BTCUSDT 14.39%', 'ETHUSDT 17.93%', 'BNBUSDT 6.11%', 'XRPUSDT -26.03%', 'ADAUSDT -6.31%', 'DOGEUSDT 43.82%', 'MATICUSDT 26.26%', 'SOLUSDT 13.47%', 'DOTUSDT -0.81%', 'LTCUSDT 66.23%', 'SHIBUSDT 25.94%', 'AVAXUSDT 36.59%', 'TRXUSDT -5.64%', 'UNIUSDT 9.91%', 'ATOMUSDT 2.33%', 'LINKUSDT -15.28%', 'ETCUSDT -3.43%', 'XMRUSDT 19.73%', 'APTUSDT 112.32%']

Overall Average Profit: 17.33%, RSI Parameters: BUY: 55, SELL: 70, LOSS STOP: 30,
Details: ['BTCUSDT 11.2%', 'ETHUSDT 24.43%', 'BNBUSDT 12.37%', 'XRPUSDT -26.84%', 'ADAUSDT -8.41%', 'DOGEUSDT 43.82%', 'MATICUSDT 23.4%', 'SOLUSDT -2.21%', 'DOTUSDT 4.32%', 'LTCUSDT 70.59%', 'SHIBUSDT 23.13%', 'AVAXUSDT 42.95%', 'TRXUSDT -6.19%', 'UNIUSDT 5.86%', 'ATOMUSDT 3.12%', 'LINKUSDT -15.28%', 'ETCUSDT -7.44%', 'XMRUSDT 19.73%', 'APTUSDT 110.7%']

Overall Average Profit: 17.33%, RSI Parameters: BUY: 55, SELL: 70, LOSS STOP: 35,
Details: ['BTCUSDT 11.2%', 'ETHUSDT 24.43%', 'BNBUSDT 12.37%', 'XRPUSDT -26.84%', 'ADAUSDT -8.41%', 'DOGEUSDT 43.82%', 'MATICUSDT 23.4%', 'SOLUSDT -2.21%', 'DOTUSDT 4.32%', 'LTCUSDT 70.59%', 'SHIBUSDT 23.13%', 'AVAXUSDT 42.95%', 'TRXUSDT -6.19%', 'UNIUSDT 5.86%', 'ATOMUSDT 3.12%', 'LINKUSDT -15.28%', 'ETCUSDT -7.44%', 'XMRUSDT 19.73%', 'APTUSDT 110.7%']

Overall Average Profit: 17.33%, RSI Parameters: BUY: 55, SELL: 75, LOSS STOP: 30,
Details: ['BTCUSDT 11.2%', 'ETHUSDT 24.43%', 'BNBUSDT 12.37%', 'XRPUSDT -26.84%', 'ADAUSDT -8.41%', 'DOGEUSDT 43.82%', 'MATICUSDT 23.4%', 'SOLUSDT -2.21%', 'DOTUSDT 4.32%', 'LTCUSDT 70.59%', 'SHIBUSDT 23.13%', 'AVAXUSDT 42.95%', 'TRXUSDT -6.19%', 'UNIUSDT 5.86%', 'ATOMUSDT 3.12%', 'LINKUSDT -15.28%', 'ETCUSDT -7.44%', 'XMRUSDT 19.73%', 'APTUSDT 110.7%']

Overall Average Profit: 17.33%, RSI Parameters: BUY: 55, SELL: 75, LOSS STOP: 35,
Details: ['BTCUSDT 11.2%', 'ETHUSDT 24.43%', 'BNBUSDT 12.37%', 'XRPUSDT -26.84%', 'ADAUSDT -8.41%', 'DOGEUSDT 43.82%', 'MATICUSDT 23.4%', 'SOLUSDT -2.21%', 'DOTUSDT 4.32%', 'LTCUSDT 70.59%', 'SHIBUSDT 23.13%', 'AVAXUSDT 42.95%', 'TRXUSDT -6.19%', 'UNIUSDT 5.86%', 'ATOMUSDT 3.12%', 'LINKUSDT -15.28%', 'ETCUSDT -7.44%', 'XMRUSDT 19.73%', 'APTUSDT 110.7%']

Overall Average Profit: 16.47%, MFI Parameters: BUY: 60, SELL: 70, LOSS STOP: 30,
Details: ['BTCUSDT 13.42%', 'ETHUSDT 23.95%', 'BNBUSDT 13.67%', 'XRPUSDT -28.98%', 'ADAUSDT -8.05%', 'DOGEUSDT 33.71%', 'MATICUSDT 19.89%', 'SOLUSDT -1.86%', 'DOTUSDT 4.57%', 'LTCUSDT 68.11%', 'SHIBUSDT 20.22%', 'AVAXUSDT 45.13%', 'TRXUSDT -6.57%', 'UNIUSDT 7.52%', 'ATOMUSDT 3.12%', 'LINKUSDT -15.28%', 'ETCUSDT -8.54%', 'XMRUSDT 19.73%', 'APTUSDT 109.09%']

Overall Average Profit: 16.47%, RSI Parameters: BUY: 60, SELL: 70, LOSS STOP: 35,
Details: ['BTCUSDT 13.42%', 'ETHUSDT 23.95%', 'BNBUSDT 13.67%', 'XRPUSDT -28.98%', 'ADAUSDT -8.05%', 'DOGEUSDT 33.71%', 'MATICUSDT 19.89%', 'SOLUSDT -1.86%', 'DOTUSDT 4.57%', 'LTCUSDT 68.11%', 'SHIBUSDT 20.22%', 'AVAXUSDT 45.13%', 'TRXUSDT -6.57%', 'UNIUSDT 7.52%', 'ATOMUSDT 3.12%', 'LINKUSDT -15.28%', 'ETCUSDT -8.54%', 'XMRUSDT 19.73%', 'APTUSDT 109.09%']

Overall Average Profit: 16.47%, RSI Parameters: BUY: 60, SELL: 75, LOSS STOP: 30,
Details: ['BTCUSDT 13.42%', 'ETHUSDT 23.95%', 'BNBUSDT 13.67%', 'XRPUSDT -28.98%', 'ADAUSDT -8.05%', 'DOGEUSDT 33.71%', 'MATICUSDT 19.89%', 'SOLUSDT -1.86%', 'DOTUSDT 4.57%', 'LTCUSDT 68.11%', 'SHIBUSDT 20.22%', 'AVAXUSDT 45.13%', 'TRXUSDT -6.57%', 'UNIUSDT 7.52%', 'ATOMUSDT 3.12%', 'LINKUSDT -15.28%', 'ETCUSDT -8.54%', 'XMRUSDT 19.73%', 'APTUSDT 109.09%']

Overall Average Profit: 16.47%, RSI Parameters: BUY: 60, SELL: 75, LOSS STOP: 35,
Details: ['BTCUSDT 13.42%', 'ETHUSDT 23.95%', 'BNBUSDT 13.67%', 'XRPUSDT -28.98%', 'ADAUSDT -8.05%', 'DOGEUSDT 33.71%', 'MATICUSDT 19.89%', 'SOLUSDT -1.86%', 'DOTUSDT 4.57%', 'LTCUSDT 68.11%', 'SHIBUSDT 20.22%', 'AVAXUSDT 45.13%', 'TRXUSDT -6.57%', 'UNIUSDT 7.52%', 'ATOMUSDT 3.12%', 'LINKUSDT -15.28%', 'ETCUSDT -8.54%', 'XMRUSDT 19.73%', 'APTUSDT 109.09%']

Overall Average Profit: 19.23%, MFI Parameters: BUY: 65, SELL: 70, LOSS STOP: 30,
Details: ['BTCUSDT 22.67%', 'ETHUSDT 29.95%', 'BNBUSDT 15.73%', 'XRPUSDT -29.24%', 'ADAUSDT -8.05%', 'DOGEUSDT 68.72%', 'MATICUSDT 26.76%', 'SOLUSDT -0.8%', 'DOTUSDT 4.57%', 'LTCUSDT 69.26%', 'SHIBUSDT 19.76%', 'AVAXUSDT 45.13%', 'TRXUSDT -6.57%', 'UNIUSDT 7.23%', 'ATOMUSDT 3.12%', 'LINKUSDT -15.28%', 'ETCUSDT -11.52%', 'XMRUSDT 19.73%', 'APTUSDT 104.15%']

Overall Average Profit: 19.23%, RSI Parameters: BUY: 65, SELL: 70, LOSS STOP: 35,
Details: ['BTCUSDT 22.67%', 'ETHUSDT 29.95%', 'BNBUSDT 15.73%', 'XRPUSDT -29.24%', 'ADAUSDT -8.05%', 'DOGEUSDT 68.72%', 'MATICUSDT 26.76%', 'SOLUSDT -0.8%', 'DOTUSDT 4.57%', 'LTCUSDT 69.26%', 'SHIBUSDT 19.76%', 'AVAXUSDT 45.13%', 'TRXUSDT -6.57%', 'UNIUSDT 7.23%', 'ATOMUSDT 3.12%', 'LINKUSDT -15.28%', 'ETCUSDT -11.52%', 'XMRUSDT 19.73%', 'APTUSDT 104.15%']

Overall Average Profit: 19.23%, RSI Parameters: BUY: 65, SELL: 75, LOSS STOP: 30,
Details: ['BTCUSDT 22.67%', 'ETHUSDT 29.95%', 'BNBUSDT 15.73%', 'XRPUSDT -29.24%', 'ADAUSDT -8.05%', 'DOGEUSDT 68.72%', 'MATICUSDT 26.76%', 'SOLUSDT -0.8%', 'DOTUSDT 4.57%', 'LTCUSDT 69.26%', 'SHIBUSDT 19.76%', 'AVAXUSDT 45.13%', 'TRXUSDT -6.57%', 'UNIUSDT 7.23%', 'ATOMUSDT 3.12%', 'LINKUSDT -15.28%', 'ETCUSDT -11.52%', 'XMRUSDT 19.73%', 'APTUSDT 104.15%']

Overall Average Profit: 19.23%, RSI Parameters: BUY: 65, SELL: 75, LOSS STOP: 35,
Details: ['BTCUSDT 22.67%', 'ETHUSDT 29.95%', 'BNBUSDT 15.73%', 'XRPUSDT -29.24%', 'ADAUSDT -8.05%', 'DOGEUSDT 68.72%', 'MATICUSDT 26.76%', 'SOLUSDT -0.8%', 'DOTUSDT 4.57%', 'LTCUSDT 69.26%', 'SHIBUSDT 19.76%', 'AVAXUSDT 45.13%', 'TRXUSDT -6.57%', 'UNIUSDT 7.23%', 'ATOMUSDT 3.12%', 'LINKUSDT -15.28%', 'ETCUSDT -11.52%', 'XMRUSDT 19.73%', 'APTUSDT 104.15%']
As you can see the winning strategy is to use:
BUY when RSI raise above 65, SELL when RSI drops below 35 or RSI drops below 70.
Testing day trading strategies for cryptocurrencies is a valuable and exciting endeavor. By using Python and the Binance trading data, we can gain valuable insights into market conditions and make more informed trading decisions.
I hope that this article has provided you with some useful information and inspiration for your own trading journey. If you’re interested in learning more about trading and cryptocurrencies, be sure to follow my channel and join my newsletter.
In my future articles, I will be exploring more day trading strategies and technical indicators, and I will also be sharing more of my Python code and insights.
So, stay tuned and join me on this exciting journey of crypto trading!
And if you’re feeling particularly generous, you could buy me a coffee at www.buymeacoffee.com/kingmichael. Your support would greatly help in keeping me motivated and writing articles that you love.