
Tensorboard Embedding Projector — Visualizing High Dimensional Vectors with t-SNE or PCA.
Tutorial on Embedding Projector with our own feature vector.
Tensorflow is a one of the most popular free and open source machine learning library which helps you to do all kind of machine learning and deep learning projects. It can be used for various tasks including training, inferencing, visualising ML and DL models. It also comes up with wide variety of pretrained models.
Now TensorBoard is the visualization toolkit for tensorflow. It helps us for the visualization of various machine learning experiements.
What can we do with TensorBoard?
- TB helps us to tracks various metrics such as loss and accuracy for ML training.
- Model Graphs can be visualized.
- We can view histograms of weights, biases, or other tensors.
- Plot high dimensional embedding to a lower dimensional space. To visualize and understands it
- Displaying images, text, and audio data
- More n More..

In this story as the title said we will be focusing on using Tensorboard embedding projector for our own use case with our own feature vector.
Before that let us see some examples of visualizations for word embedding and image feature vectors.
Word2Vec Embeddings Example

MNIST with Images example.
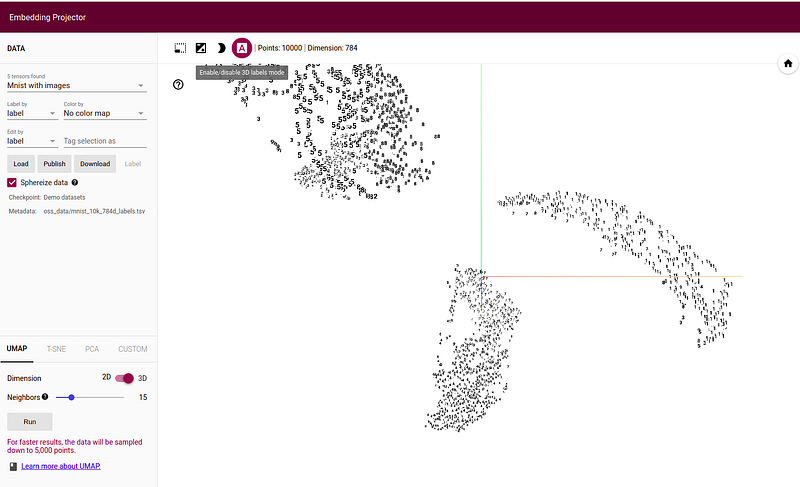
There are two ways you can use Embedding projector with tensorboard.
1) Direct Upload [EASY METHOD] You can upload the feature vector and metadata in the format that is specified in this link. Here there will be a load button.
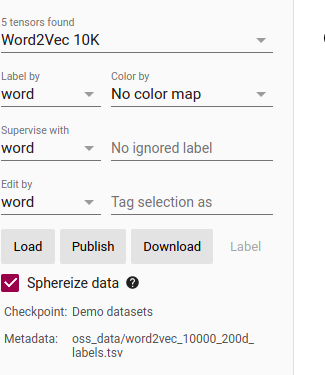
Now you can load the data that you want to visualize. Now we have to understand what is the format of loading the data. In order to visualize you need to upload the feature vector in a tsv format. Each line represents a feature vector with separated by ‘\t’ space. Then you have to add the metadata in a tsv format as well. The order of feature vectors and tags should be same that is how it maps the tags for visualization. Now if you want to give the class also then in the metadata with a tab separated column you can also specify the class. But if you add two columns it is necessary that you should add column names.


2) Using local tensorboard
Using tensorboard Embedding projector on local machine, first of all you need to install tensorflow.
Now you need to import and load necessary packages and extensions.
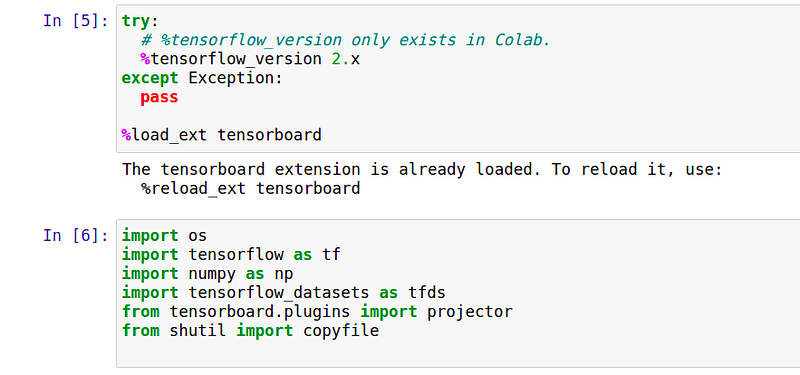
Here we import tensorboard extension. After that we load projector from tensorflow.plugins.
Now you have to set up a logs directory, so Tensorboard knows where to look for files.
For that you need metadata.tsv and also features.txt (vectors in txt format). You can make both of this whatever way you prefer.

Here I am creating a log directory called test and inside test, I am copying metadata.tsv which I already created out of this notebook contains the metadata and features.txt which contains the feature vectors. For metadata it is the same as the above case on how you can make it. But for the features.txt I just appended every features in order to a list and saved it using np.savetxt function. Check below.

Now atlast you need to run the tensorboard. That can be done with the below command.

You can see the embedding projector on your notebook cell. But for better view go to your browser and look for localhost:6006 . If it shows some error just try to reload the dashboard it may help.
Now to use the t-SNE plot effectively checkout this link below.
I hope this story helped you for better understanding on how to use tensorboard. Thanks for reading and Thanks for your time.


