
Technical Analysis with Python
Technical Analysis (TA) is the analysis of stocks based on previous time series features as prices and volume. The series can be analyzed statistically, or plotted, to spot patterns that helps to predict future behaviors.
We can use Python to fuel this analysis. This article is an introduction to TA with Python. We will be using Bitcoin data that is available at https://finance.yahoo.com/quote/BTC-USD/history?p=BTC-USD to download the data we are going to use the library yfinance:
To do the Technical Analysis we can use the library talib:
import talib
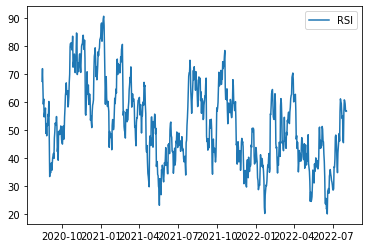
Now let’s get the Relative Strength Index (RSI), this indicator can help to determine if an asset is overbought or oversold. The range of RSI values is between 0 and 100.
rsi = talib.RSI(data["Close"])
Note that we are using the Close price column to calculate the rsi.
rsi.tail()
Date
2022-07-29    60.589750
2022-07-30    59.438286
2022-07-31    56.931639
2022-08-01    56.748439
2022-08-02    56.878482
dtype: float64
Plotting the rsi using the matplotlib library:
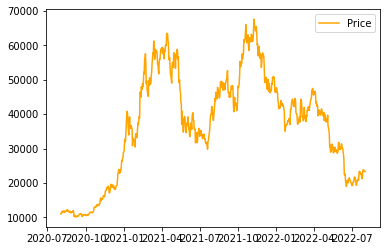
Plotting also the closing price:
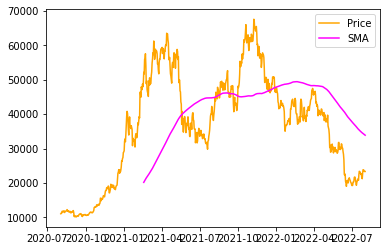
Moving Average
The Moving Average is one of the most used indicators to see trends, reducing the noise in the price signal. Here we are calculating a 200 days Moving Average:
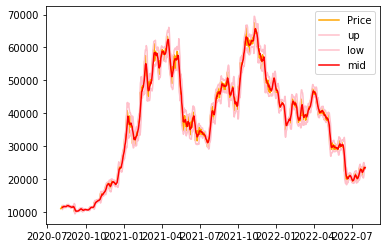
Bollinger Bands
The Bolinger Bands are basically ranges of deviations. If some prices lies outside can be considered as kind of abnormal behavior. It can be use to see if the asset price is overextended. They could signal times for buy or sell.
Conclusion
We show you 3 Technical Indicators, there are several more indicators that can be calculated using Python. How this can be helpful? Well you can trade manually using the Technical Analysis derived from the use of Python or you can build a bot to trade when you think the indicator meet certain criteria.
If you find value in this article, please consider clapping and following. On the next article we will be making a simple bot to trade, stay tune, see you!


