
Technical Analysis Pt 1: Understanding the Significance of the 200 EMA and MACD on the 4-Hour Chart for the BTC-USD Pair
Just as gravity ensures that what goes up must come down, we must be cautious when certain cryptocurrency projects rise too quickly.
Over the past few months, the cryptocurrency market has been extremely bullish, with Bitcoin and other leading altcoins such as Solana, Ethereum, BNB, Avalanche, and Fantom, showing significant gains.

For non-members, read the full article here for free.
Bitcoin recently broke above its 2021 all-time high of $69,000 and attempted to break the $74,000 level before experiencing a significant sell-off. But was $73,880 the peak for Bitcoin in this bull run? I don’t think so.
Does it mean Bitcoin is dropping below $10,000 soon? That’s hard to predict.
Somehow, it’s funny to hear people still wishing that Bitcoin drop below $10,000 because they missed buying it below $20,000 in the early stages of the bull market.
So, if you’re among those waiting for Bitcoin to drop back to $10,000, I wish you good luck. But your wishes may not come true.
Now, what’s next for Bitcoin after retesting the 200 EMA on the 4-hour chart and reclaiming the 20 EMA on the daily chart? Should we be excited or more cautious about the market conditions?
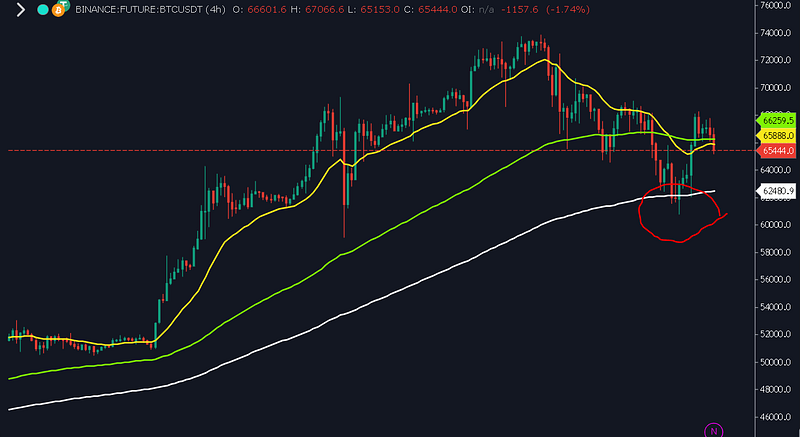
If you’ve read my recent articles, you’d know there was no need to panic during the recent pullbacks we had in the market, as pullbacks are normal in a bull market.
In this article, I emphasized the importance of buying Bitcoin during pullbacks at the 200 EMA on the 4-hour chart, while also considering other EMAs such as the 20, 100, and 200 on the daily chart.
Sometimes, EMAs alone aren’t sufficient to predict Bitcoin’s next move. That’s why we use the 200 EMA and the MACD indicator on the 4-hour chart to monitor the market.
The strategy is straightforward: we focus on the overbought and oversold areas on the MACD and the bullish and bearish crossovers that occur on the 4-hour chart. See the screenshot below.
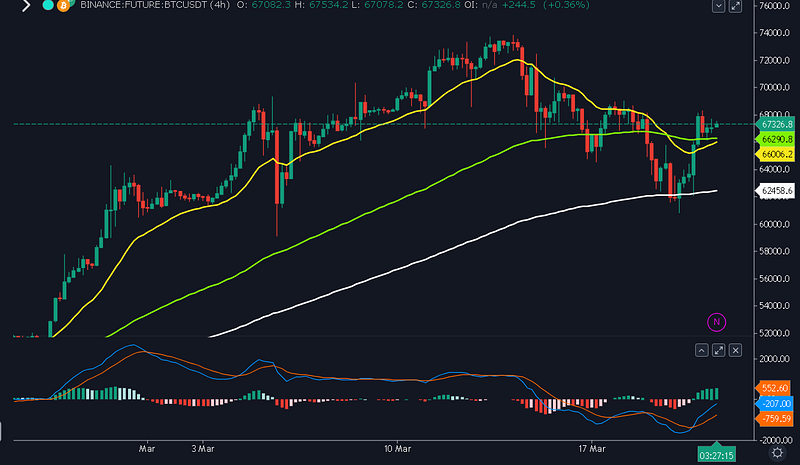
To begin, go to the indicator section on your charting app and search for the MACD. This indicator doesn’t require any configuration; we can use the default settings to analyze the BTC-USD pair on the 4-hour chart.
The MACD, or Moving Average Convergence Divergence, is a widely used momentum indicator that helps traders identify trends, spot potential reversals, and measure momentum.
At times, we also use the MACD to determine overbought and oversold levels, although it’s less reliable than the RSI.
I often use the MACD to find entry and exit points when analyzing assets on the 4-hour chart, providing clear zones for buying or selling.
So, when an asset is oversold on the 4-hour chart and the MACD signals a bullish crossover with the histogram turning neutral or green, it may suggest that bulls are re-entering the market, especially during an uptrend.
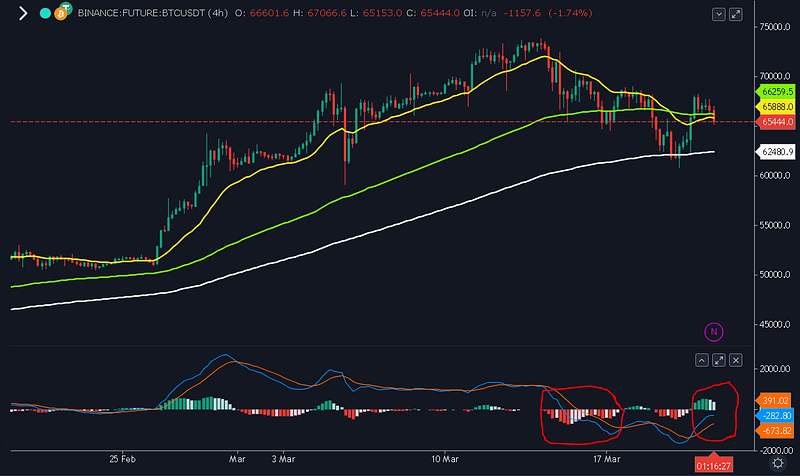
However, the MACD crossover alone shouldn’t be the only factor you consider when trading. In a strong bullish uptrend, the MACD can remain in the oversold area for an extended period while the asset’s price continues to reach new highs.
To use this method effectively, pay close attention to the red and green histogram and the bullish and bearish crossovers. See the example below.
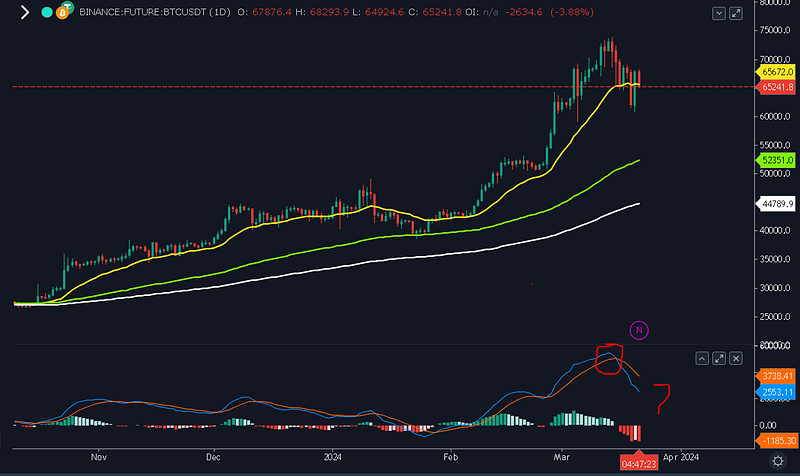
Higher Timeframe Analysis
Looking at the daily chart, the MACD crossover indicates a bearish structure. However, this doesn’t necessarily mean that Bitcoin will fall to $10,000. Instead, a minor pullback or consolidation at this level is expected before Bitcoin makes its next move.
A shift from red to neutral on the histogram suggests a potential market reversal, but the two lines above the histogram need to reset to confirm a bullish continuation. See the screenshot below.
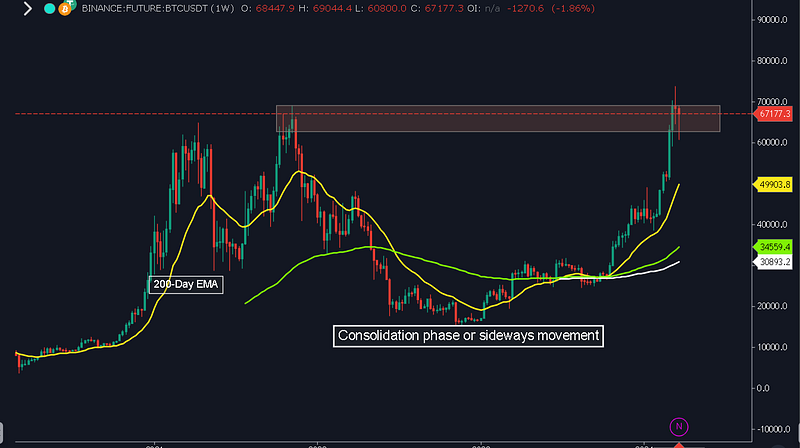
Weekly Timeframe Analysis
When analyzing the market using concepts like support and resistance, demand and supply, and various structures and patterns, you must pay attention to the break and retest of market structure for the continuation of trends.
On the weekly chart for the BTC-USD pair, Bitcoin has recently retested the previous resistance area at $69,000, which is now serving as a support level.
As long as Bitcoin maintains this bullish structure, we remain technically bullish if it closes the weekly candle above $60,000. See the image below.
Final Thoughts
Finally, there’s no need to worry about pullbacks unless an extraordinary event occurs that could fundamentally impact the price of Bitcoin and the overall cryptocurrency market. Until then, stay calm and enjoy the opportunities the market presents.
If you want to deepen your understanding of technical analysis, market structures, and patterns like double tops, double bottoms, and head and shoulders, and how to use technical indicators effectively to become a successful trader, download a copy of “The Traders Manual Handbook”.
Click Here to Download a Copy of The Trader’s Manual Handbook
Thanks for reading.
Invest wisely.


