
I Built a Machine Learning Model to Trade Stocks Like Warren Buffett (Part 1)
Use Machine Learning to Analyze a Stock’s Fundamentals
Click below for Part 2:
When it comes to trading in the Stock Market, there are many different approaches to find the right stock. Many forms of analysis have emerged to detect which stock is worth the money. Technical Analysis — determines price patterns over time in hopes that these patterns will emerge again. Sentimental Analysis — is based on the public’s general feeling or attitude towards a specific stock. If they feel negative, then the stock will tank. If they feel positive, then the sky’s the limit. Fundamental Analysis — observes a company’s financials like their Balance Sheet or Cash Flow Statement to determine if the company has value relative to their current stock price. These are not the only forms of stock analysis out there but they are arguably the most popular.
Warren Buffett, considered to be one of the most successful investors in the world, is a big proponent of Fundamental Analysis. Now if one of the most successful investors in the world uses this strategy, then we should learn this strategy for ourselves. But not all of us have patience and time to learn Fundamental Analysis. So what if we can get a machine to do the learning for us?
Classification in Machine Learning
This is where Machine Learning comes into play. We are going to be implementing a machine learning classifier to determine whether a stock is a Buy, Sell, or a Hold. In order to determine whether a stock or company falls into one of these three categories or classes, we will be taking a look at each company’s quarterly report. These quarterly reports contain the necessary financial information we require to train our machine learning classifier in the ways of Fundamental Analysis.
The Fundamental Data — Quarterly Reports
A large amount of quarterly reports will need to be collected in order to train our classifier model. Stockpup.com contains the quarterly report history from numerous companies and has made them available to download in convenient CSV or Excel files. (Note: Stockpup.com is no longer active.) But, how many companies’ quarterly report history should you download? As many as you can, if not all quarterly reports on the site. Some companies listed on the website no longer exist but that doesn’t mean that their quarterly report history is useless. We can still use that data when training our classifier.
Since Stockpup is no longer active, I suggest going with EOD Historical Data. This site contains an API that can access the necessary fundamental data to train our classifier along with other stock market data as well. It is free to sign up and try out! Disclosure: I earn a small commission from any purchases made through the link above.
Examining the Quarterly Reports
Once we have downloaded the necessary fundamental data (quarterly reports), we can take a look at how the data is formatted below displayed using a Pandas DataFrame:
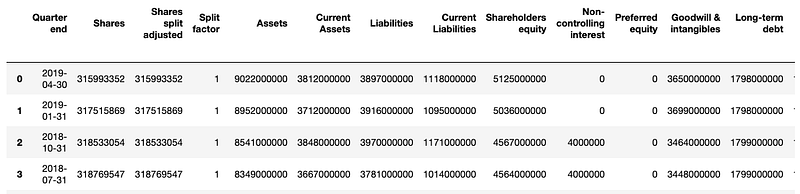
Here we can observe all the different columns and dates corresponding to each column. Now let’s take a look at the Price, Price High, and Price Low columns. This information is usually not provided in quarterly reports but Stockpup.com is kind enough to supply this, which is important for us in determining if the stock is a Buy, Hold, or Sell.
Now, there are various and unique ways to determine whether a stock is worth investing in or not. Could we potentially classify it as a Buy if the Assets increased and Liabilities decreased over the course of three quarters? Or maybe if the Shares increased and Long-term debt decreased? Anyways, we can see there are numerous options to determine the stock’s class. Simply put, this is the basis of Fundamental Analysis.
Performing our own Fundamental Analysis
How do we fundamentally analyze these quarterly reports without knowing Fundamental Analysis? Since we are not Fundamental experts like Mr. Buffett, let’s try to simplify it with our own method of fundamental analysis:
- Based on a quarterly report from any chosen quarter, observe how much the values changed from the previous report to the currently selected one.
- Then, observe the price values from the next quarterly report to see if there were any significant jumps in price.
- Finally, with the present report containing the changes from the past report and the future report’s price behavior, determine if it is a Buy, Hold, or Sell.
Essentially, we are detecting if fundamental changes from the previous to the current quarter affect future prices. We will be judging the performance of each quarterly report relative to its last report and then observing the future’s price behavior. See the diagram below for clarification:
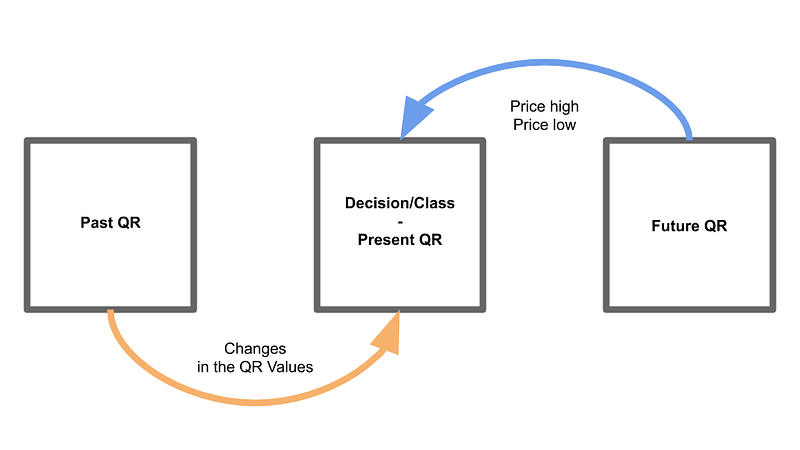
We will be applying this method of analysis to each quarterly report to create our new fundamental data. This method will classify if a stock is worth investing in for the quarter. Evidently, we won’t be able to use this method on the very first QR or on the most recent QR because the nature of the analysis requires a past and future quarterly report.
Cleaning and Formatting the Data
Creating our Class Labels
To categorize or classify each quarterly report, we will keep things uncomplicated. If the price went up a significant amount in the next quarter, then it’s a Buy. If down, then it’s a Sell. If neither, then a Hold.
Here are our specific class requirements for each observed quarterly report:
- Buy — Price high and Price low increase by 3% or more in the next quarter.
- Sell — Price high and Price low decrease by -3% or more in the next quarter.
- Hold — If neither happens.
There are other possible outcomes we could consider but for the sake of simplicity, let’s keep these conditions as they are. We won’t know the next quarter’s Price high and Price low for the most recent quarterly report because that would be knowing the future, which is impossible.
Fundamental Data from Quarterly Reports
For our fundamental data (Shares, Assets, etc.), like mentioned before, we will be observing two QRs to create new values. The changes from the previous QR to the current or present QR will be measured as a percent change instead of their actual value. For example:
Let’s say in the previous quarter, Shares show a value of 1,000. Then in the current quarter, Shares now show a value of 1,100; an increase of 10%. Now, we replace the Share value of 1,100 with 10% for our current QR.
We do this process for every QR (excluding the very first one because we can’t compare it to something that doesn’t exist). Now every QR has percent change for each Fundamental value.
Coding out our Fundamental Analysis
Now that we have the QRs formatted with percent changes and labeled as Buy, Hold, or Sell, we can move on to showing the programming process:
Importing Libraries and Dataset
The pickle file is a dictionary of DataFrames that contain the QRs for every ticker/company found on Stockpup.com. In order to follow along, you’ll have to replace the pickle file we used with a DataFrame of QRs for each ticker you were able to download formatted as a dictionary of DFs.
Helper Functions to Assist in the Preprocessing
Iterating through each Ticker to Transform the Data
A couple things to note:
- First and last rows are excluded because the first row is unable to show change and the last row has no future quarter to find price values.
- All DataFrames from the dictionary of DFs are combined as one in order to train our classification model later on.
- Index is reset because dates are no longer required. Each row or QR now contains information from the past and future QRs so dates are no longer important for the model.
- Price related features or columns are dropped to prevent data leakage. In normal QRs, these features are not included.
Finally, we have our fundamental data correctly formatted and transformed in the way that we desired. We export the final DF for data exploration and to train the classification model.
Exploring the Data
Next, in order to become more familiar with our data, we will have to perform some simple Exploratory Data Analysis. We do this to better understand our data and make sure there are no lingering issues we may have missed when we transformed the data. So let’s begin coding it out with some visualizations.
Library Imports and Loading in the DF we created earlier
Visualize the Count of our Classes
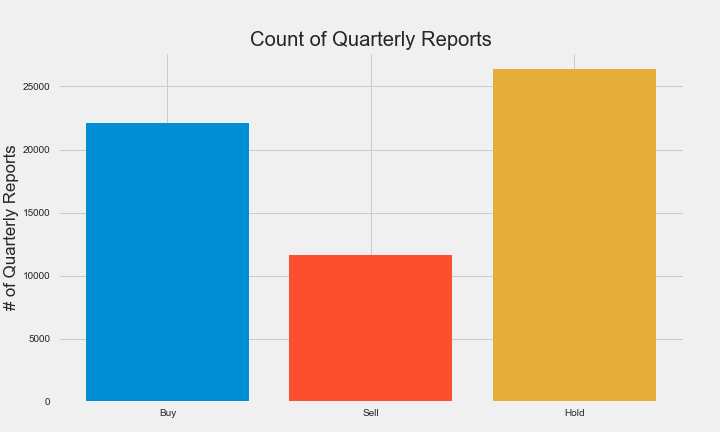
As you can see, there is a class imbalance issue with our data. This may be a problem but we do not want to discard data points so that each class equals the class with the least amount. Even though that may be a viable solution to class imbalance, there are other options we can explore. Another option would be using a different evaluation metric when validating our classification model. We will expand on this option when get to the modeling phase.
Correlations in our Data
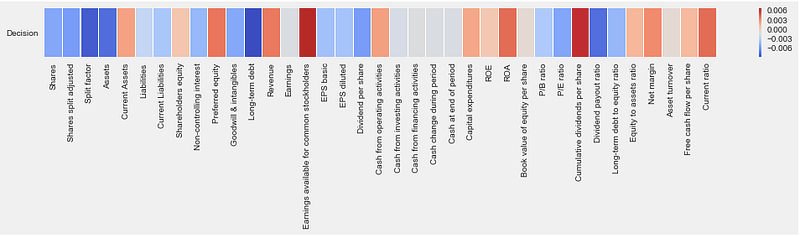
From what we can see, some features are influential in determining the class label. Some have little to no correlation to the Decision of whether or not the stock/quarterly report is worth Buying, Selling, or Holding. Now that we know some features from the QR are unimportant in determining the class label, we can remove those features from the dataset.
Feature Engineering and Selection
Now that we have explored our data a little bit, we could continue doing some more exploration or move onto the Feature Engineering process or more specifically, Feature Selection. Feature engineering is the process of altering our dataset in order to enhance our machine learning models. There are a number of options for engineering the features of our dataset. They include but are not limited to:
- Creating interactive features. Have two distinct features interact with each other to create a brand new feature.
- Reducing the number of features. Since we have over 30 fundamental features, we could eliminate unimportant features in order to improve the performance of our models.
- Using domain knowledge. If we knew which features were most essential to a stock’s price based on economic and financial research, then we could attribute weights to those features.
Feature Selection
For the purposes of this project, we will simply be eliminating unimportant features. By doing so, we can potentially improve our model’s accuracy and also reduce training time. This action is known as Feature Selection; the process of selecting features we consider necessary for our model. We will show 2 different ways of Feature Selection. This way we can compare and contrast the performances of our model with slightly different datasets due to our methods of selection.
Method #1: Selecting the Top 10 Features based on Correlation Values
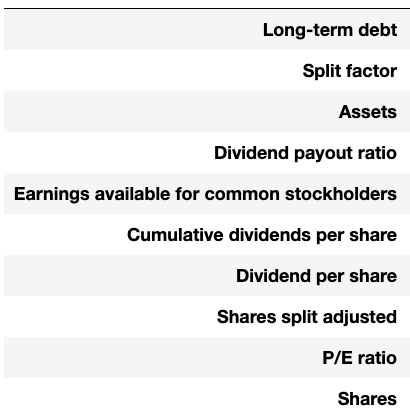
Using the correlation matrix we created while we were exploring the dataset, we select the top 10 features correlated with the Decision class labels (see above image). This is done by:
- Taking the absolute value of each feature (to handle negative correlations).
- Sorting by the absolute values.
- Slicing the number features to only include the top 10 most correlated.
- Joining the Decision class labels so that they are included in the new DF.
- Exporting the Top 10 Correlation DF as a pickle file.
Nice! We now have a new reduced but concentrated dataset for our classification models. Hopefully this new dataset enhances our classification models and speeds up training time.
Method #2: Selecting the Top 10 Features based on a Tree Classifier
This next method of Feature Selection will be a little bit more complicated than the one we just did. By using Sci-Kit Learn’s library, we will be implementing a Decision Tree based classifier to determine which features are most important. By using this classifier, we will be able to determine which features are most important when classifying the QR or stock.
Next, with our important features all sorted out, we’ll visualize them to see exactly which features were determined to be most important. Just to get an idea of which features were selected.
Running this code will give us:
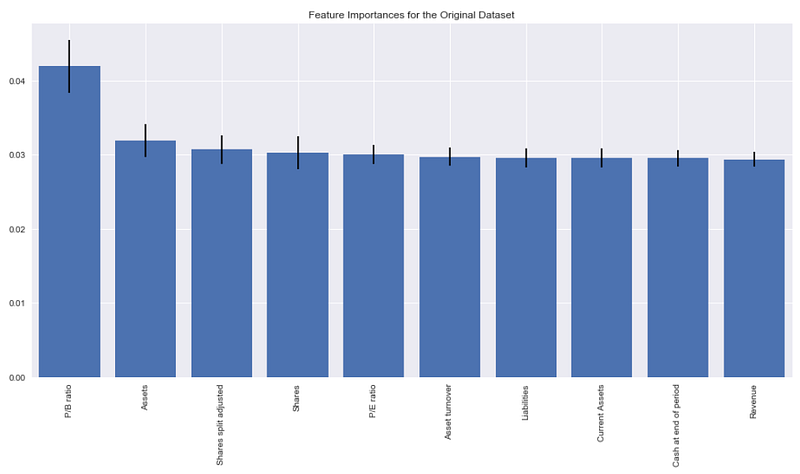
According to our forest.feature_importances_ method, these are the Top 10 most important features:
- P/B Ratio
- Assets
- Shares split adjusted
- Shares
- P/E Ratio
- Asset turnover
- Liabilities
- Current Assets
- Cash at end of period
- Revenue
The last line in our code exported the DF of the 10 most important features. Now we have two Top 10 DFs with some different and some same features represented in both. We can use both of these DFs to find out which performs better with our machine learning classifiers.
Next up, Machine Learning Classifiers
With our data cleaned, formatted, and selected, we can move on to classifying stocks based on their Quarterly Reports! In the next part, we will be coding out multiple different machine learning classifiers and finding out which classifier performs the best with our data.
Click below for Part 2:


