
Tableau Dates — How to Compare Same Day Last Week in Tableau

In this tutorial, we’ll discuss how we can compare Dates of the Week. We must know Dates is one of the baffling topics to learn in Tableau, and it’s a crucial topic everyone must know to work on different Tableau Projects effectively. We must also be able to differentiate between a continuous and a discrete date. A good Tableau Developer or Data Analyst must know what every Date function in Tableau represents.
There are several Date functions we ought to be familiar with, which includes DATEPART, DATETRUNC, DATEADD, DATENAME, DATEDIFF and so on. We can use each of this function in a calculated field to compute what we want to do with our Date field.
Let’s demonstrate what we’re interested in today. We want to compare the same day last week in Tableau. Follow each of the steps outlined below to see how to do it in Tableau Desktop.
Step 1
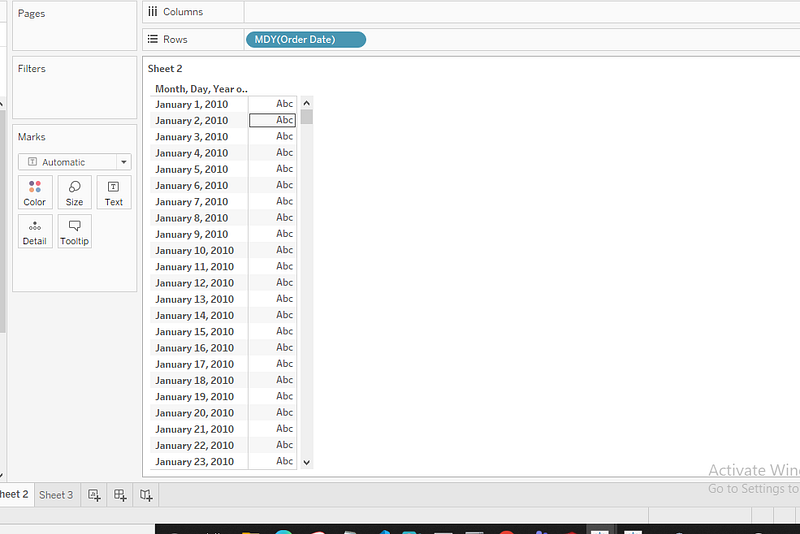
We’ll be using Tableau Superstore dataset to demonstrate. Open your Tableau Desktop and bring in your data. After bringing in your data, the first thing to do is to drop Order Date in the Row Pane.
Change the date to a custom date format(Month/Day/Year). Then we have our date as shown below;
Step 2
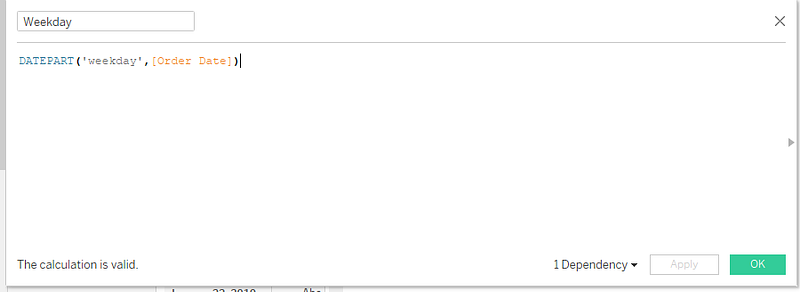
What we do next is to create a calculated field for our weekday by using the DATEPART function. So, we do that by using the calculated field shown below;
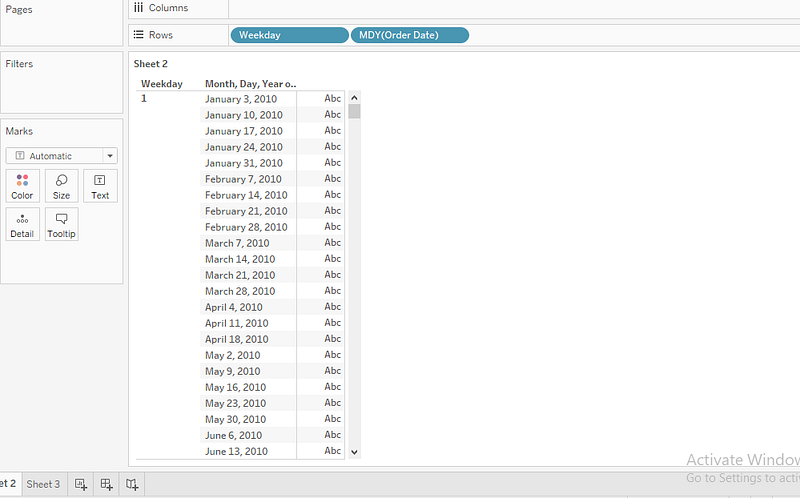
Drop this field on the Row Pane at the left of our Order Date. We should have the table below. In this table, we can deduce that our first date is jan3, the next one is Jan10, whereby both are Sundays, and this goes on for other dates.
Step 3
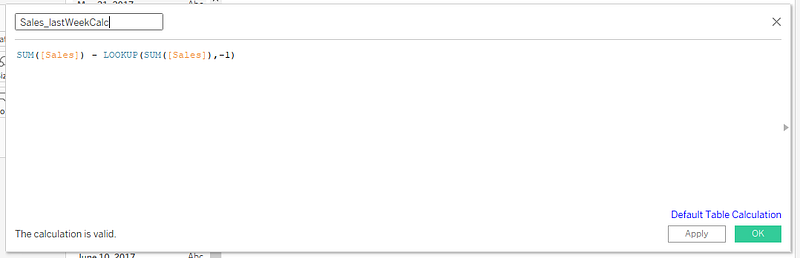
The next step is to compare our sales with the same day last week. We can do this by calculating the difference in sales between that day and that day of the previous week. We’ll represent this in a calculated field as shown below;
After we’ve done that, let’s drop this field in the Pane by dragging the Measure Values in the Text Card and the Measure Names in Columns, whereby we filter out Measures we don’t need. So we should have our Sales and Sales_DiffCalc on the marks card.
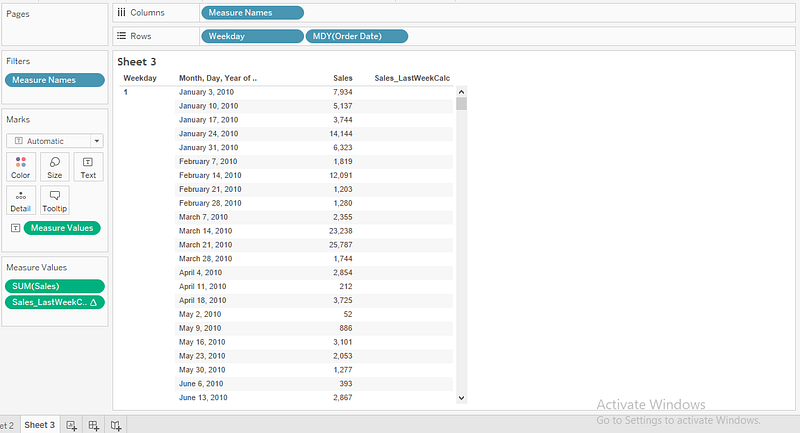
From the table above, we don’t have any values in our Sales_DiffCalc field. What we need to do is edit the table calculation for this field. We can compute table calculation by right-clicking Sales_DiffCalc under the measure values marks, then you Click Edit Table Calculation, and select Table Down.
After then, you should have this table shown below;
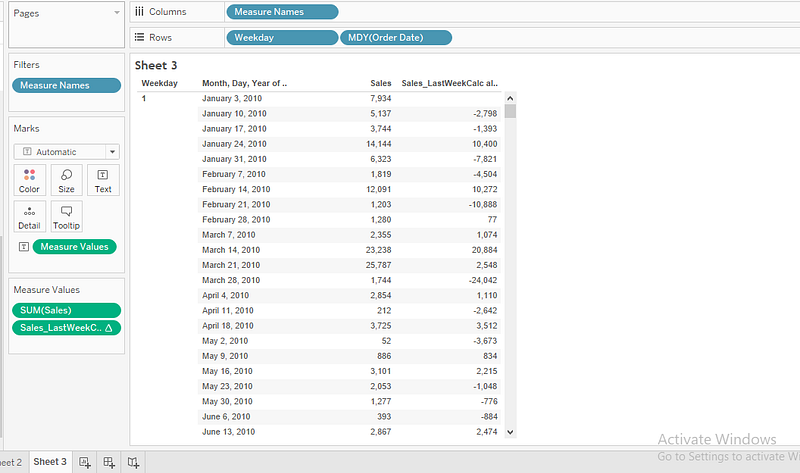
From the table above, you can observe we don’t have any value on Jan 3rd for our Sales_LastWeek Comparison. This is because we don’t have any date before Jan 3rd as seen in our table; therefore Jan 3rd will be left empty, so we compute for the other dates using Table Down computation approach.
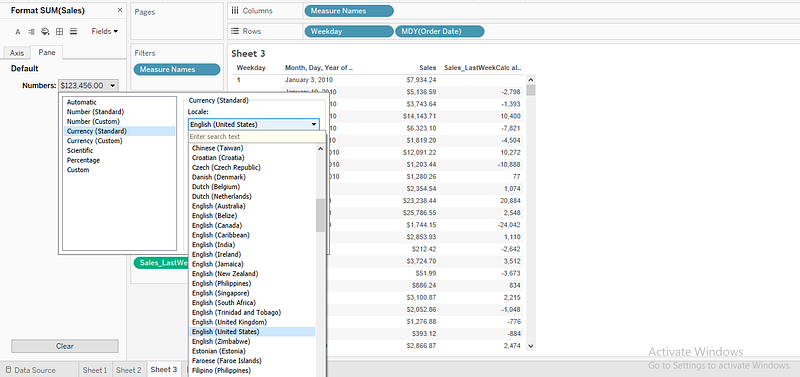
Let’s go further to format our sales value, whereby we add a currency symbol before the value. To do that, you right-click on the Sales field on the Marks card, then select Format. On the Format Page, click Pane → Numbers → Currency(Standard) → English(United States), just as shown below.
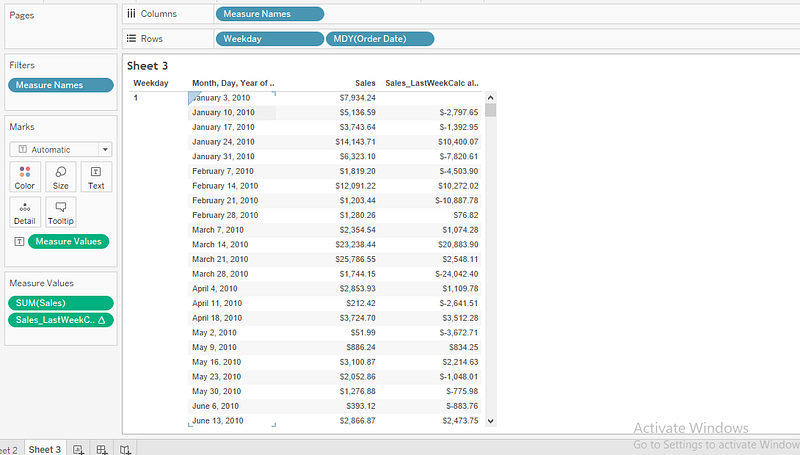
After that, you also format your Sales_LastWeekCalc field in the marks card to have currency like we did earlier. Our final table should be like this as shown below;
Did you find this post helpful? Let’s know in the comments section below.
If you enjoy reading stories like these and want to support our writers, consider signing up to become a Medium member. It’s $5 per month, giving you unlimited access to stories on Medium. If you sign up using our link, we’ll earn a small commission.