
Machine Learning
Support Vector Regression (SVR) — One of the Most Flexible Yet Robust Prediction Algorithms
A visual explanation of SVR with Python implementation examples
Intro
Machine Learning is making huge leaps forward, with an increasing number of algorithms enabling us to solve complex real-world problems.
This story is part of a deep dive series explaining the mechanics of Machine Learning algorithms. In addition to giving you an understanding of how ML algorithms work, it also provides you with Python examples to build your own ML models.
This story covers the following topics:
- The category of algorithms that SVR belongs to
- An intuitive explanation of how SVR works
- A few examples of how to build SVR models in Python
What category of algorithms does Support Vector Regression belong to?
While you may not be familiar with SVR, chances are you have previously heard about Support Vector Machines (SVM). SVMs are most frequently used for solving classification problems, which fall under the supervised machine learning category.
With small adaptations, however, SVMs can also be used for other types of problems such as:
- Regression (supervised learning) through the use of Support Vector Regression algorithm (SVR)
- Clustering (unsupervised learning) through the use of Support Vector Clustering algorithm
These use cases utilize the same idea behind support vectors, but each has a slightly different implementation. This enables us to use these algorithms across different categories of machine learning.
The below graph is interactive, so make sure to click on different categories to enlarge and reveal more👇.
If you enjoy Data Science and Machine Learning, please subscribe to get an email whenever I publish a new story.
In general, you can use SVR to solve the same problems you would use linear regression for. Unlike linear regression, though, SVR also allows you to model non-linear relationships between variables and provides the flexibility to adjust the model's robustness by tuning hyperparameters.
An intuitive explanation of Support Vector Regression
Before we look at the regression side, let us familiarize ourselves with SVM usage for classification. This will aid our understanding of how the algorithm has been adapted for regression.
Support Vector Machines (SVM)
Let’s assume we have a set of points that belong to two separate classes. We want to separate those two classes in a way that allows us to correctly assign any future new points to one class or the other.
SVM algorithm achieves that by finding a hyperplane that separates the two classes with the highest possible margin. The points that end up on the margins are known as support vectors (see illustration below).
Sometimes, however, it may not be possible to separate the two classes correctly, or you may have some outliers which fall inside the margin. Any such misclassified points or points inside the margin would be penalized. This is where the “slack” value comes in, denoted by a greek letter ξ (xi, pronounced “ksi”). You may ignore it for now, but it will become more relevant when we look at support vector regression.
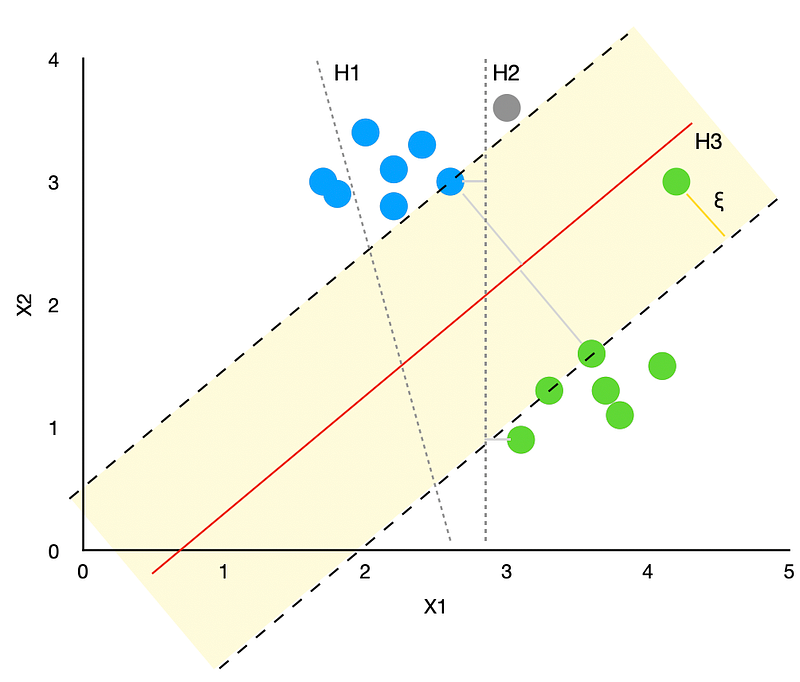
In the graph above, we have a class of blue points and a class of green points. We try a few different hyperplanes to separate the points with the following results:
- H1 was not able to correctly separate the classes. Hence, it is not a viable solution.
- H2 separated the classes correctly, but the margin between the hyperplane and the nearest point is quite small. Hence, there is a high chance of incorrectly classifying any future new points. E.g., the new grey point (x1=3, x2=3.6) would be assigned to the green class by the algorithm when it is obvious that it should belong to the blue class instead.
- H3 separates the two classes with the highest possible margin, making the model a lot more robust. This ensures that we are more likely to assign future new points to the right class correctly. Note, we did have one outlier that has fallen inside the margin.
Support Vector Regression (SVR)
In general, SVR is quite similar to SVM, but there are some notable differences:
- SVR has an additional tunable parameter ε (epsilon). The value of epsilon determines the width of the tube around the estimated function (hyperplane). Points that fall inside this tube are considered as correct predictions and are not penalized by the algorithm.
- The support vectors are the points that fall outside the tube rather than just the ones at the margin, as seen in the SVM classification example.
- Finally, “slack” (ξ ) measures the distance to points outside the tube, and you can control how much you care about it by tuning a regularization parameter C (more about it in the Python section below).
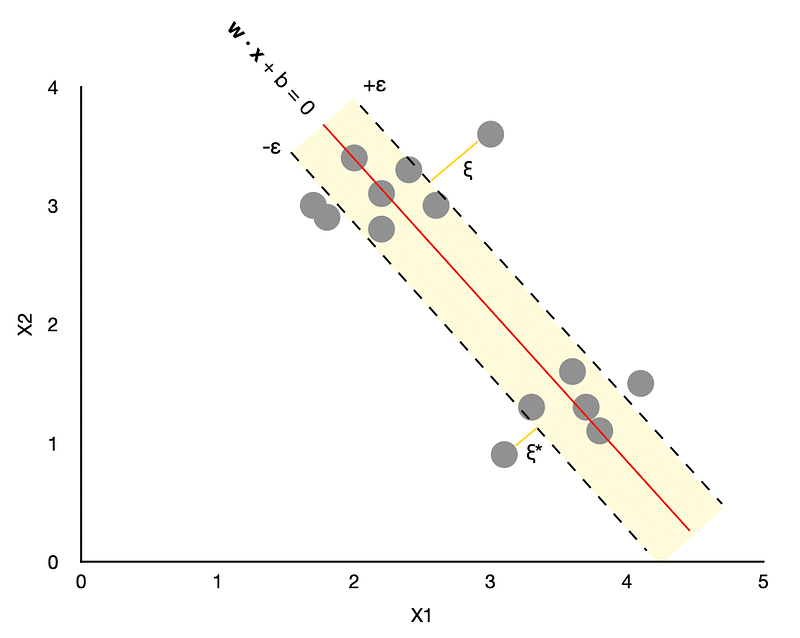
A simple way to think about SVR is to imagine a tube with an estimated function (hyperplane) in the middle and boundaries on either side defined by ε. The algorithm's goal is to minimize the error by identifying a function that puts more of the original points inside the tube while at the same time reducing the “slack.”
While the above explanations focus on linear examples, SVM and SVR algorithms can also handle non-linear situations through a kernel trick. A kernel is a function (you can choose between a few different ones) that takes the original non-linear problem and transforms it into a linear one, which is then handled by the algorithm in a higher-dimensional space.
While I will not go into the details about kernel functions, you will see how to pick between different ones in the Python examples section below. However, if you are interested in how kernel functions work, you can refer to my SVM and RBF kernel story here:


How to build SVR models in Python?
Now that we have some background about SVRs, it is time to build a couple of Python prediction models. Similar to other regression algorithms analyzed in my previous stories, we will utilize the following data and Python packages:
- House price data from Kaggle
- Scikit-learn library for: - perform feature scaling (MinMaxScaler) - building SVR and linear regression models
- Plotly library for visualizations
- Pandas and Numpy
Setup
First, we import the required libraries.
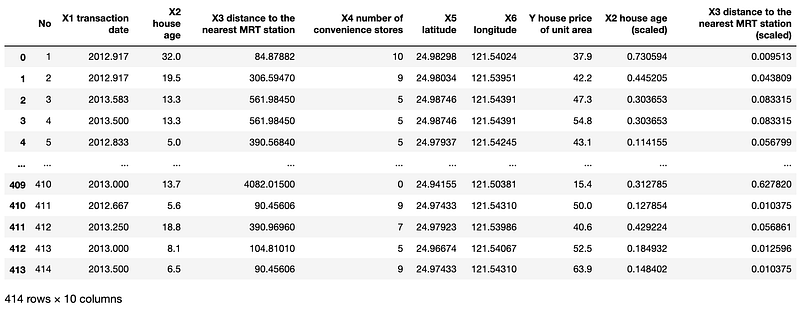
Next, we download and ingest the data that we will use to build our SVR and linear regression models. Note, we also perform Min-Max scaling on features X2 and X3. I will explain the reason for this later on when we build a model with 2 independent variables. (source: https://www.kaggle.com/quantbruce/real-estate-price-prediction?select=Real+estate.csv)
SVR vs. simple linear regression — 1 independent variable
We will take ‘X3 distance to the nearest MRT station’ as our input (independent) variable and ‘Y house price of unit area’ as our output (dependent) variable and create a scatterplot to visualize the data.
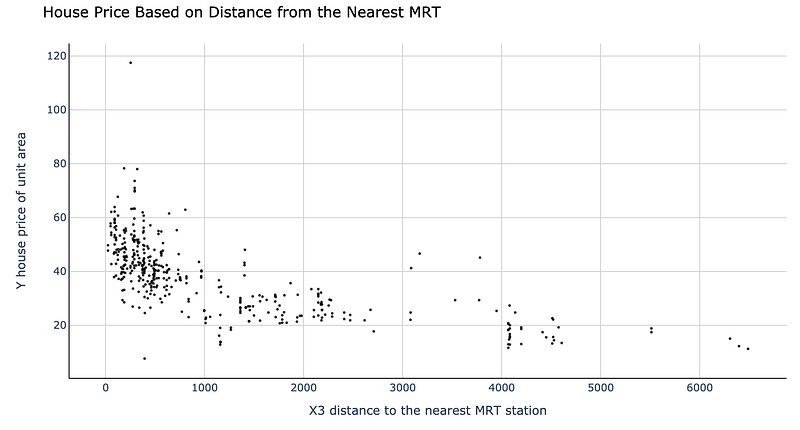
As we can see from the graph above, there is a clear relationship between the two variables, with house price (per unit area) decreasing as the distance from the nearest MRT station increases.
Let us now fit the two models. Note, we use the following hyperparameter values for the SVR model: epsilon = 10, C = 1. As explained before, epsilon defines the width of the tube around the hyperplane. Meanwhile, regularization parameter C allows us to assign the weight to “slack,” telling the algorithm how much we care about the error.
Also, we use the default ‘rbf’ (radial-basis function) kernel. Other choices available in sklearn’s SVR package are: ‘linear’, ‘poly’, ‘sigmoid’, and ‘precomputed’.
With fitting done, let’s visualize the two models.
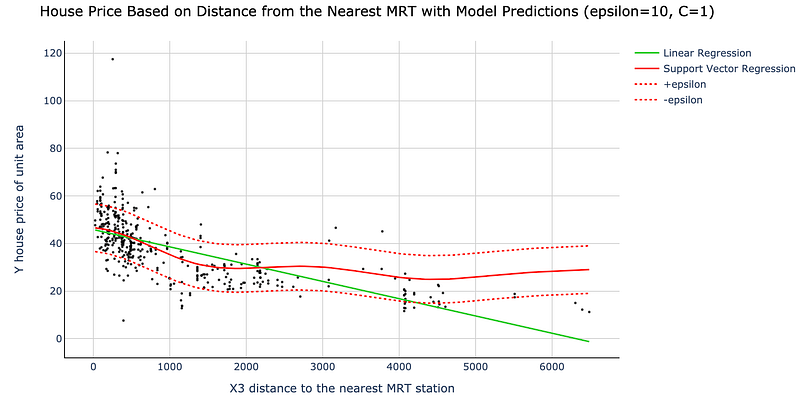
Visually we can see how support vector regression is much more flexible compared to linear regression. SVR can capture the slope change as the increase in the distance from the nearest MRT has a diminishing effect on a house's price.
Meanwhile, simple linear regression has only one slope parameter, meaning that it maintains the curve's steepness throughout, overestimating the relationship at higher distance values.
Let us now adjust the hyperparameter C, increasing it to 1000, and see how that affects the SVR model. Note, the Python code we use is identical to the one above apart from C=1000 instead of C=1. Here are the results visualized:
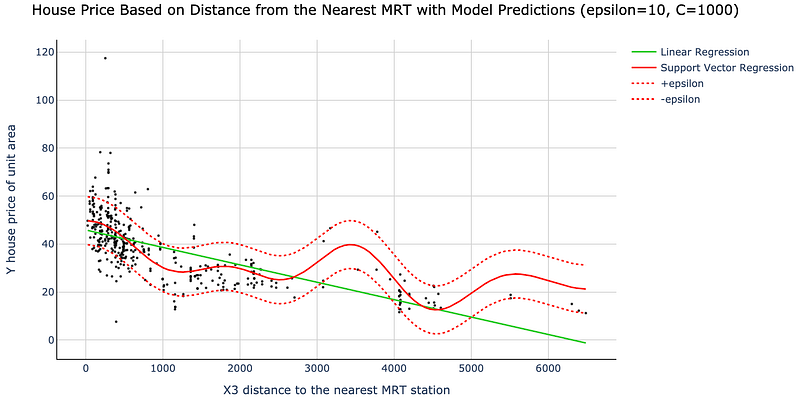
You will note how increasing C to 1000 created a much more “wavy” best-fit line. By increasing C's value, we told the algorithm that we care a lot more about minimizing the “slack.” The algorithm responded to this by capturing more points inside the epsilon-tube.
While increasing C allows us to fit the data better, it also makes our model less robust, risking overfitting. Hence, it is best to be cautious when tuning hyperparameters and split the data into training and testing datasets so you can evaluate your model with unseen data.
SVR vs. multiple linear regression — 2 independent variables
Let’s now take a look at another example using multiple independent variables.
Given that SVR relies on distances between data points, it is beneficial to scale independent variables to ensure that they fit into the same range. Without scaling, we would have the most variation along the dimension with the highest range, leading to a worse prediction model.
We start by creating a 3D scatterplot with the scaled versions of ‘X3 distance to the nearest MRT station’ and ‘X2 house age’ as our independent variables.
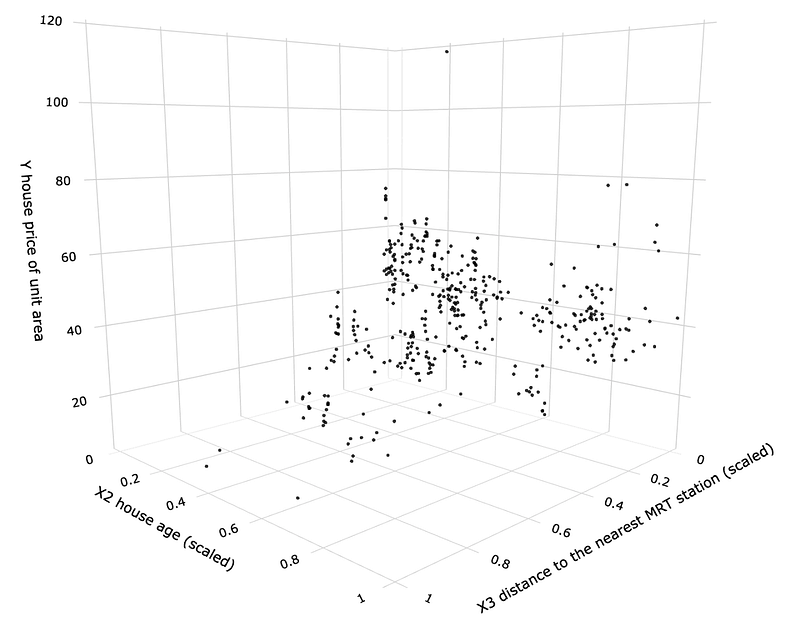
We can see from the graph that the house price tends to increase as the house age decreases. Although the relationship between X2 and Y is not as strong as the one between X3 and Y, it will still improve our model.
Let us now fit the two models and create a prediction plane. This time we use the following hyperparameters for the SVR model: epsilon = 1, C = 100. Note that we do not go through hyperparameter tuning in these examples. This means that the above hyperparameters may not be ideal for this model. Therefore, you should train and test multiple versions of the model to identify more optimal hyperparameter values.
As we now have all the data ready, let us use Plotly again to create two 3D scatterplots. The first one contains a prediction plane from the linear regression model, and the second one shows the same for SVR.
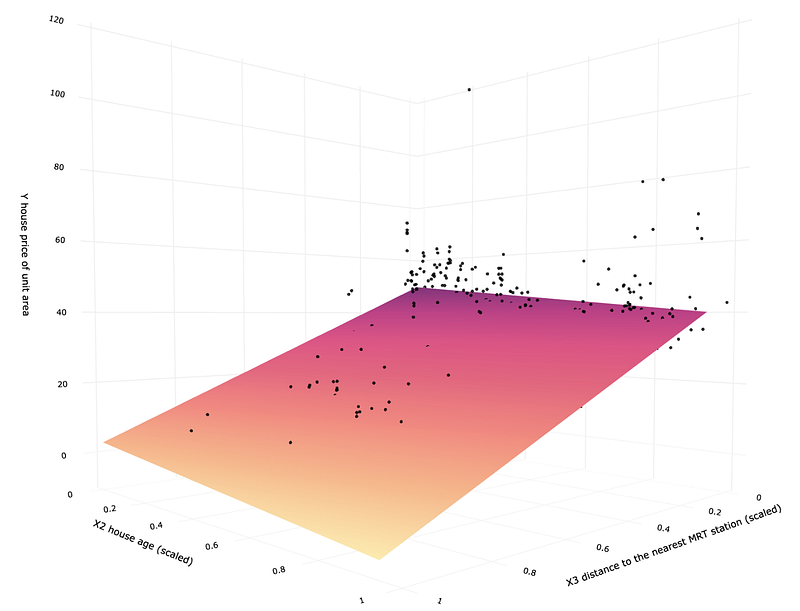
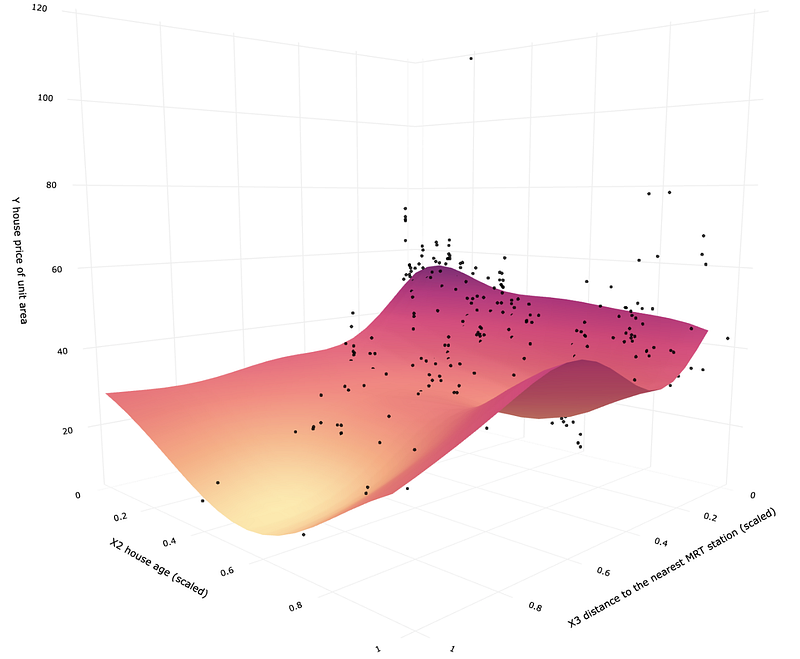
It is easy to see the difference between the two models. Multiple linear regression creates a prediction plane that looks like a flat sheet of paper. Meanwhile, SVR is more like a soft fabric that you can bend and fold in whatever way you need to fit your data better. This gives you a lot more flexibility and enables you to get a more accurate model.
I have also embedded an interactive graph for you to explore.
Conclusion
Support vector regression algorithm is a huge improvement over simple linear regression. It allows you to build non-linear models and gives you control over the flexibility vs. robustness of your models.
As long as you are willing to spend a little bit of time tuning hyperparameters and evaluating model performance on the test samples, you will be able to get some excellent results.
I hope you found this useful! You can find the complete Jupyter notebook in my GitHub repository. Please feel free to reach out if you have any feedback or questions. If you would like to learn about alternative regression methods, I have included links to my MARS and LOWESS stories below.
Cheers! 👏 Saul Dobilas
If you have already spent your learning budget for this month, please remember me next time. My personalized link to join Medium is:


