
The Streamlit Colour Picker: An Easy Way to Change Chart Colours on Your Streamlit Dashboard
Provide Your Dashboard Users with Greater Flexibility

Streamlit is a popular and powerful Python-based open-source framework that lets you quickly and easily create interactive data science dashboards and deploy machine learning models.
One of the useful features of Streamlit is the colour picker tool. This allows you to add flexibility to your dashboard by letting users select any colour they want rather than using the default hard-coded colour.
This short tutorial will show you how easy it is to implement the Streamlit Colour Picker widget within a dashboard.
If you are new to Streamlit, then you may want to check out my previous Streamlit tutorials to get you off to a great start:
- Getting Started With Streamlit Web Based Applications
- Creating True Multi-Page Streamlit Apps — The New Way (2022)
- Getting Started With Streamlit: 5 Functions You Need To Know When Starting Out
Installing Streamlit
If you haven’t already installed the Streamlit library, you can use the following command in your Terminal or Command Prompt.
pip install streamlit
After Streamlit has been installed, we can create a new file called app.py . This is where we will be adding our code.
Import Libraries
The first step is to import a number of libraries: Streamlit, numpy, pandas and matplotlib.
We will use numpy and pandas to create some example data and matplotlib to generate a scatter plot of that data.
import streamlit as st
import matplotlib.pyplot as plt
import pandas as pd
import numpy as np
Create Data
Next, we need to create some dummy data in the form of a dataframe.
To do this, we first create a numpy array of random integers between 0 and 100 that spans 100 rows and 3 columns. This will give us enough data to display on a plot. Also, note that the data will change each time we rerun the app using this function. If we don’t want this to happen, we need to add a line to set the seed.
np.random.seed(42)We then pass this array into pd.DataFrame and assign the letters A, B and C as the column names. This makes things easier when referencing these columns later on.
arr_random = np.random.randint(low=0, high=100, size=(100,3))

data_to_plot = pd.DataFrame(arr_random, columns=["A","B","C"])
Setup the Streamlit Page
The next part is to set up our Streamlit app. For this example, we will keep it very basic.
First, we will create a header st.header() and a new variable for storing the user's colour choice. This assigned to st.color_picker(). And all we need to do is pass in a label name.
st.header('Streamlit Colour Picker for Charts')

user_colour = st.color_picker(label='Choose a colour for your plot')
To find out more about the colour picker widget, check out the documentation page below.
Setup the Matplotlib Figure
We now need to create our figure using matplotlib. This is achieved by setting up fig and ax variables and assigning them to plt.subplots() . Within this function, we just need to pass 1,1 to indicate we are creating a figure with 1 row and 1 column.
Next, we will call upon ax.scatter, and pass in the user_colour variable we created above to the c (colour) parameter.
Finally, to get Streamlit to display the matplotlib scatter plot, we need to call upon st.pyplot() and pass in the fig variable.
fig, ax = plt.subplots(1,1)
ax.scatter(x=data_to_plot['A'], y=data_to_plot['B'], c=user_colour)

st.pyplot(fig)
Running the Streamlit App
Now that the basic code has been written, we can run the Streamlit app. To do this, we need to enter the following in the terminal:
streamlit run app.pyThis will then launch Streamlit in your default browser.
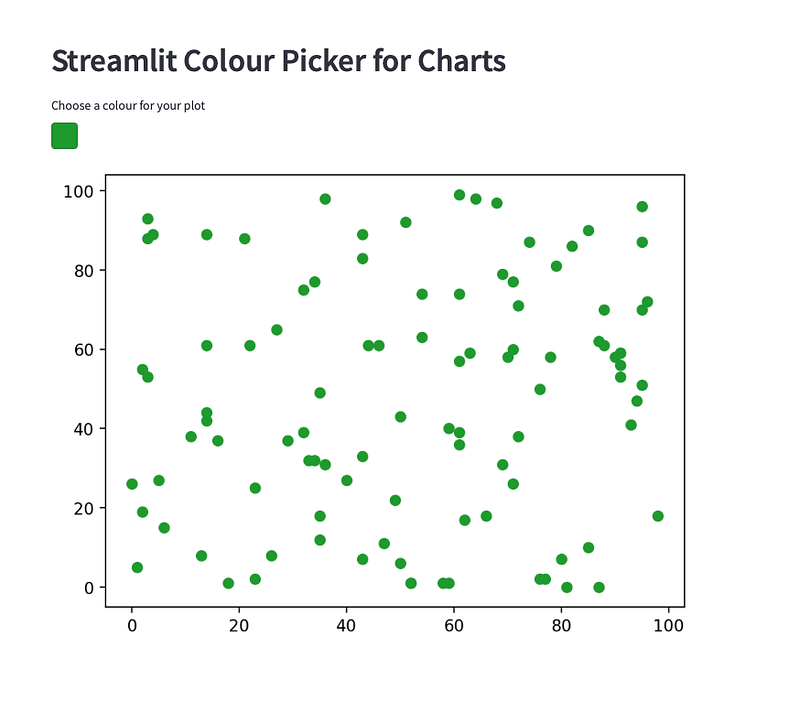
Once it has launched, we will see the basic app with our colour picker tool and the matplotlib figure.

To change colours, we need to click on the colour box and select a new colour. Once you click off the colour picker box, the chart will update with the new colour.

Setting the Default Value to Streamlit the Colour Picker
By default, the colour picker will be set to black (#000000). We can pass in our own hex code to the st.color_picker() function to the value parameter.
user_colour = st.color_picker(label='Choose a colour for your plot',
                              value='#1F9A2E')
When the app is next launched, the colour for the picker will default to the value that was set.
Summary
Within this short tutorial, we have seen how to add an interactive colour picker to our Streamlit dashboard. This saves having to hard code colours and allows you to provide the dashboard users more flexibility. It is very simple to implement and can add much more useability to your Streamlit creations.
Thanks for reading. Before you go, you should definitely subscribe to my content and get my articles in your inbox. You can do that here! Alternatively, you can sign up for my newsletter to get additional content straight into your inbox for free.
Secondly, you can get the full Medium experience and support me and thousands of other writers by signing up for a membership. It only costs you $5 a month, and you have full access to all of the amazing Medium articles, as well as the chance to make money with your writing.
If you sign up using my link, you will support me directly with a portion of your fee, and it won’t cost you more. If you do so, thank you so much for your support


