
Statistical Analysis in Python
Using Skimpy for Statistical Summary of Dataframes
Statistical Analysis of the dataset helps in identifying trends, patterns, and relationships between different data points of quantitative data. It helps in unraveling hidden patterns that are underlying in the data and are not visible to naked eyes. It generally contains skewness, quartile, mean, etc.
Pandas provide describe function which can be used for generating the statistical analysis but it only displays summaries like mean, median, etc. and we need to use other functions like shape, type, etc to find out other properties of the dataset. But what if I tell you that we can do all this in a single line of code and generate a summary of the dataset?
Skimpy is an open-source python library that is used to generate a statistical summary of the quantitative datasets and can be used in Juptyer Notebook as well as console also.
In this article, we will explore Skimpy and create some statistical analysis using it.
Let’s get started…
Installing required libraries
We will start by installing Skimpy using pip installation. The command given below will install Skimpy using pip.
pip install skimpyImporting required libraries
In this step, we will import all the libraries that are required for creating the statistical analysis and loading the data.
from skimpy import skim, generate_test_data
import seaborn as sns
Creating Statistical Summary
We will start by creating the statistical summary in a jupyter notebook, the dataset that we will be using here is defined under seaborn with the name Tips. Let’s create the Statistical Suymmary:
df = sns.load_dataset("tips")
skim(df)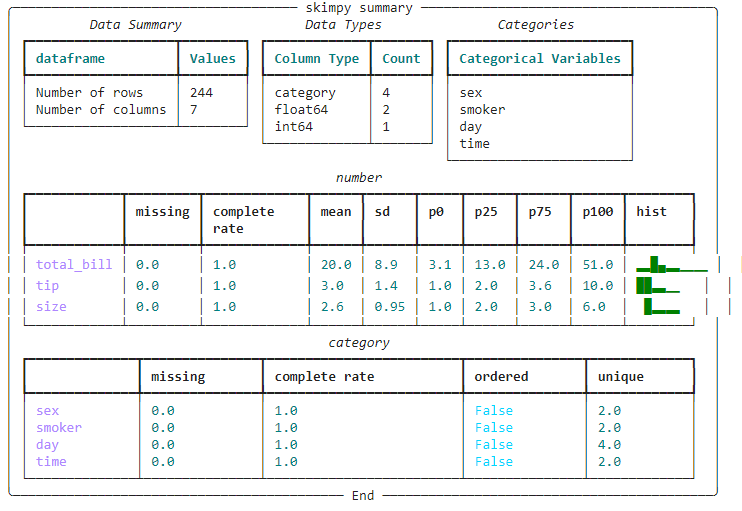
Here we can clearly see the analysis generated which contains all the data points and summary related to it. It contains Data Types, categories, Missing data, etc.
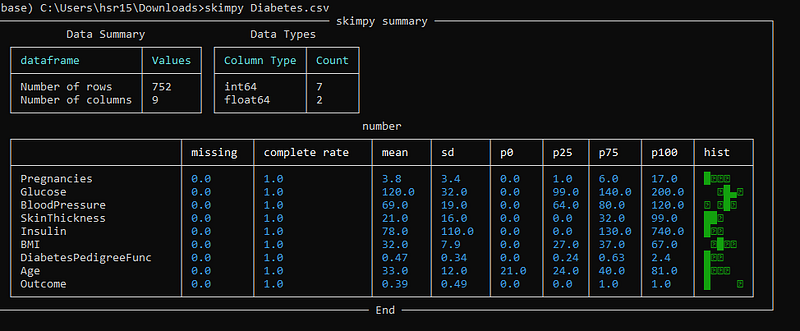
Now let us see how to create this analysis in the console. We can do that by simply running the command given below. Remember to change the file name while running the command.
skimpy Diabetes.csvHere you can see how easily we can create the statistical summary easily from both console and notebook.
Try this with different datasets, create a Statistical Summary, and let me know your comments in the response section.
This article is in collaboration with Piyush Ingale.
Before You Go
Thanks for reading! If you want to get in touch with me, feel free to reach me at [email protected] or my LinkedIn Profile. You can view my Github profile for different data science projects and packages tutorials. Also, feel free to explore my profile and read different articles I have written related to Data Science.


