
Stata graph schemes
In this guide learn how to create your own Stata graph schemes. Additionally, this guide also releases a host of new schemes for your day-to-day Stata use:
Stata schemes are templates that define how graph are drawn. The scheme files are text files with a .scheme extension that can be modified and saved in your local directory for use. These text files are fairly extensive with well over 1700 options for fine tuning various graph elements including colors, backgrounds, sizes, legends, text etc.
Despite the flexibility of generating schemes, surprisingly little has been produced over the years. Some of the popular themes that have come out in the past years are the plotplain and plottig released in the blindschemes package (Bischof 2017):
ssc install blindschemes, replaceThe plotplain scheme has been further modified by Mize (2018) to come up with the cleanplot scheme, which I also frequently recommend for my guides:
net install cleanplots, from("https://tdmize.github.io/data/cleanplots")Other schemes are also floating around the internet, but one rarely sees them being used. This official Stata article covers several of them:
But why should we use or define a scheme, when all elements can be controlled directly through the dropdown menu or the syntax? Well, this is simply for the sake of efficiency. For day-to-day use, especially for research work, one cannot go around fine-tuning individual elements for all the graphs. While I do discuss these elements extensively in my previous guides, this level of fine-tuning make more sense for finalizing graphs at the last step or generating highly customized data-science-type visualizations. Plus, having ready-to-use (and nice looking) schemes cuts down several steps required for modifying graph elements.
The purpose of this guide is two-fold. In Part I, it discusses how one can customize their own schemes. In Part II, it introduces a host of schemes that have been generated using Stata’s s2color, plainplots, and cleanplots schemes as starting templates. This part goes over what these schemes look like and how to install them.
Part I: How to generate your own Stata schemes
Scheme files are text files that are read by Stata at the time of drawing the graph. All the scheme files are placed in the Stata ado directory. Ado files are Stata programs and you can find out where they are by typing:
sysdirThis will give you all the paths where system files are copied. Here you need to access your Stata base directory. This directory is divided into alphabetical subfolders. So for my own Stata copy, I can find the schemes in the ./ado/base/s folder:
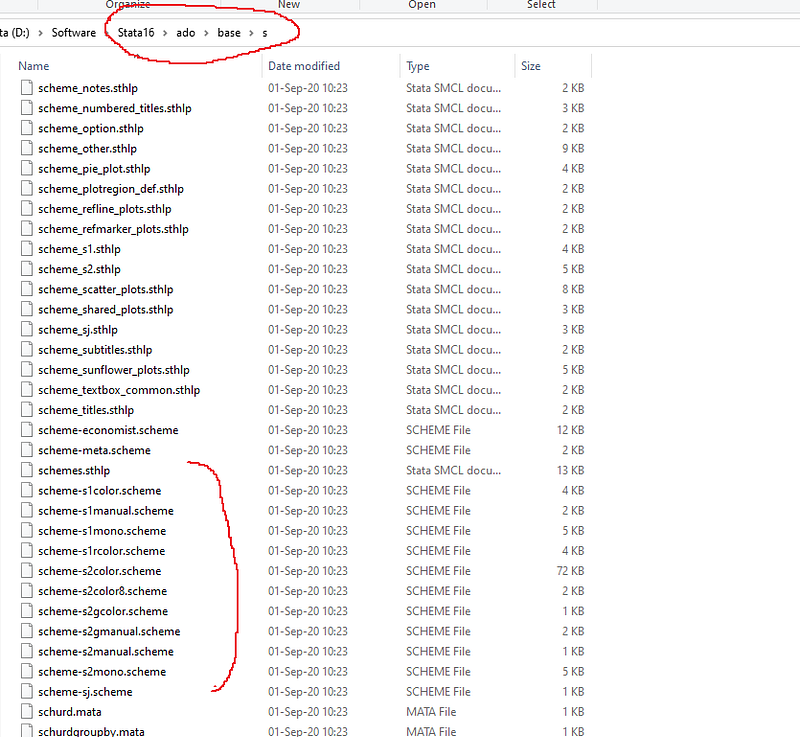
In the screenshot above you also see the popular scheme-s2color.scheme. You can copy this to your own directory and open it with any text editor like Notepad or Notepad++ (highly recommended!) or any text software.
NOTE: NEVER ever open or modify official files in system directories (for any software). This can cause errors in the execution of programs. Plus any update will overwrite any modifications you have made. ALWAYS copy programs to other directories before even opening them.
If you have installed schemes from the internet, then on Windows they will typically be in the c:/ado/plus/s personal folder. Again check these paths using the sysdir command in Stata. The personal directory contains all the user-installed programs (e.g. when you use ssc install). As you can see from the screenshot below, I have a bunch of schemes already in my folder:
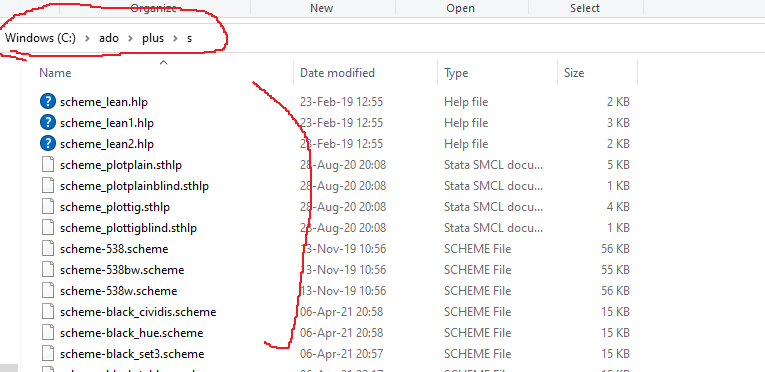
Anything that exists in this directory with the following name:
scheme-<name>.scheme
is read by Stata as a graph scheme. The schemes show up in the graph window as well.
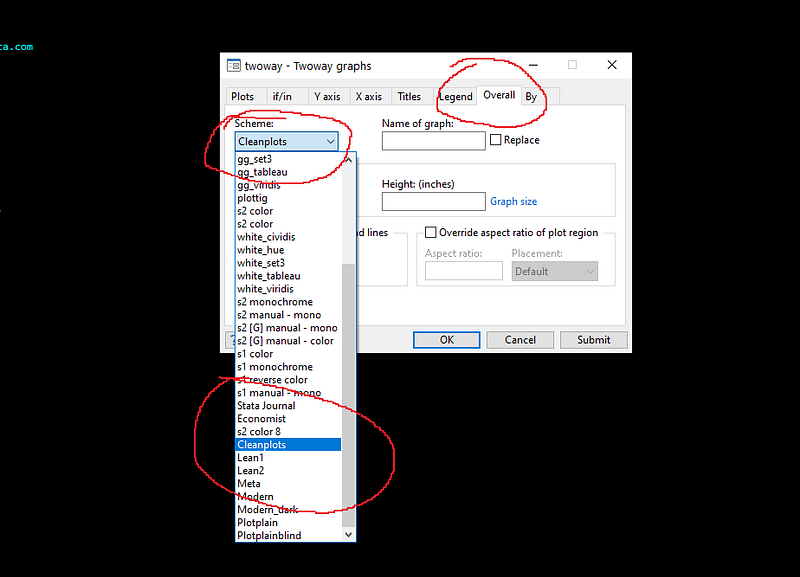
Using this drop-down menu is one way of selecting a scheme for your graph. If you are working on your dofiles, you can either call a scheme directly while making a graph:
sysuse auto, clear
twoway (scatter mpg headroom), scheme(cleanplots)
Or you can just tell Stata to use a specific scheme at the beginning of your dofile:
set scheme cleanplotsYou can also just set a scheme as the default option:
set scheme cleanplots, permIf you copy and open the scheme-cleanplots.scheme in your ado directory in a text editor, it looks something like this:
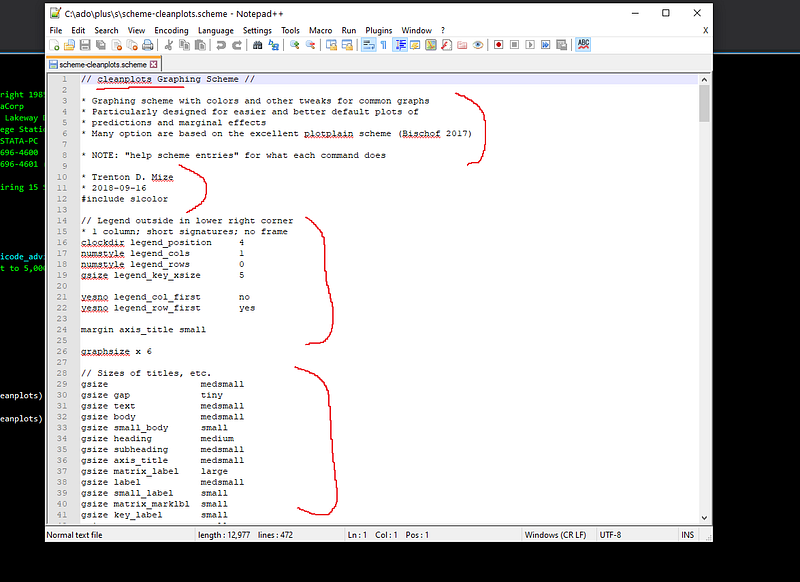
It contains text describing its origin, who made it, when it was released etc. Always good to have these entries for documents and version control. It also says that this scheme is built on top of the s1color scheme in line 12 in the screenshot above:
#include s1colorThis means that whatever is not defined in the scheme, is taken from the s1color scheme defaults. As I mentioned earlier, there are well over 1700 options that are set for schemes but one does not need to modify all of them. One can take any scheme template and build on top of it.
The next set of entries define the scheme. These are options one does not use on a day-to-day basis. To start with scheme modification, you can have a look at the following command in Stata:
help scheme files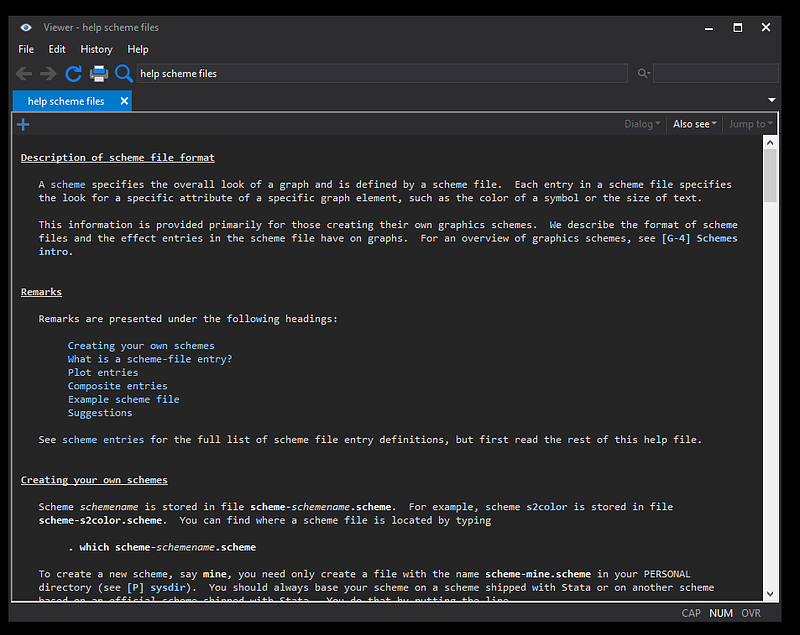
This is a fairly extensive and well-documented guide for modifying schemes. One can also look at different scheme entries:
help scheme entries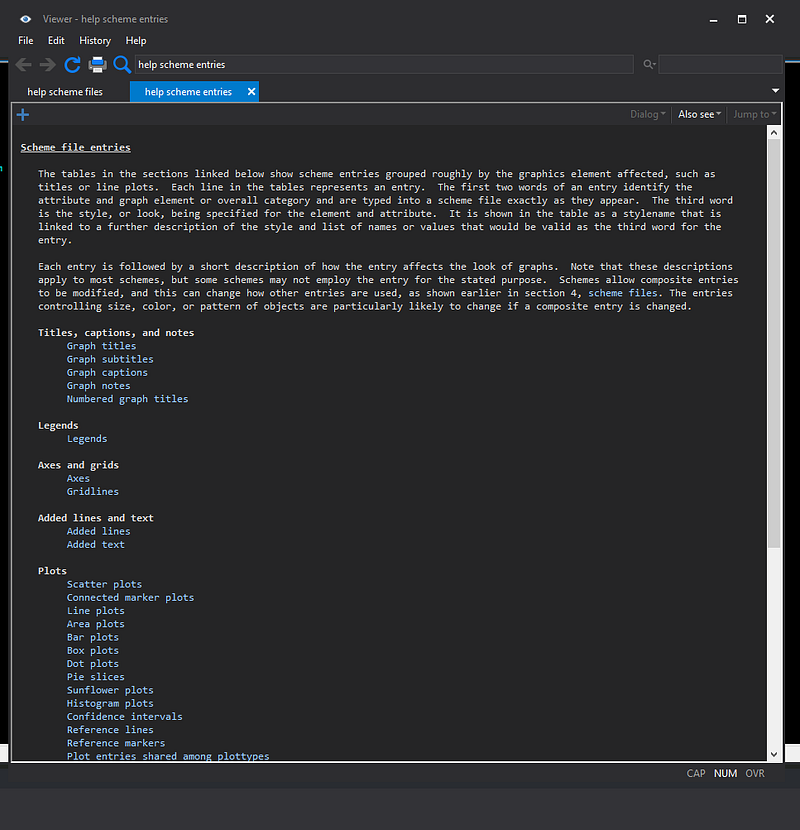
This menu gives all the possible options of customizing elements of each graph type. While these menus are very detailed, the key ones to look at are core graph entries for titles, captions, legends, axis and grids plus information on individual graph types for lines, colors, areas etc.
For example for scatter plots we get this menu:
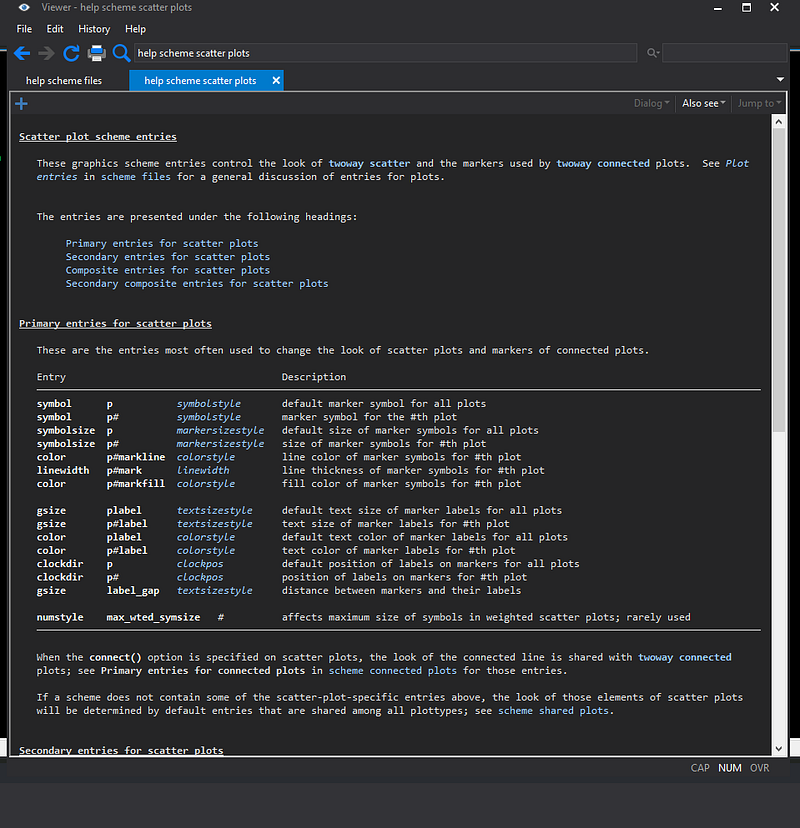
Note how symbol is defined. One can either define all symbol elements collectively:
symbol p circleor one can add entries for individual symbols:
symbol p1 circle
symbol p2 square
symbol p3 triangle   // ...and so one
Similarly one can either define one color for markers, or each marker separately:
// overall color
color pmarkfill black
// individual colors
color p1markfill red
color p2markfill green
color p3markfill blue // etc etc.Also note that these names are different from what one uses in the twoway graph option. Here one would define marker colors as:
twoway (scatter y x, mcolor(red)) In scheme files, the rule-of-thumb is that 15 markers or lines or colors should be specified (also the Stata default). If there are more than 15 entries, the colors cycle back to the first entry. This is defined by the following entry in the scheme files:
numstyle pcycle 15This number can be higher or lower depending on how many color/symbol variations one wants to add.
As I discuss at length in the Color Guide, Stata can also read RGB colors. For example, instead of writing:
color pmarkline red // outline of symbolsone can also write:
color pmarkline "255 0 0"This opens up the possibility to add any color in the scheme files. This also allows one to use some nice color templates or even build a theme around some brand or corporate identity.
Once one decides on a color scheme, symbols etc., it is fairly easy to implement it in the scheme file. There is a lot of copy-pasting involved though. And fine tuning various elements requires some time investment. This also includes figuring out the right commands and then playing around with various options till one gets a nice balance. Personally, a good way to start is to take the minimalistic plainplots or cleanplot themes, make a copy of either one of them, and start modifying the various elements. One can also implement scheme templates from other softwares, like R and Python, where there is a much more active community or even build schemes that are similar to popular, well thought-out, data science websites.
Here I would also like to highlight two packages written for generating schemes by long-term Stata contributors. First is brewscheme by William Buchanan. This package allows users to pass on the graph options on to a scheme file. The second one is grstyle by Ben Jann with a similar concept. I have my own simple scheme writing script. Once I clean it up, I will release it as a guide here!
Part II: Introducing SCHEMEPACK
As I mentioned earlier, scheme are fairly easy to modify once one gets the hang of it. I have released a bunch of ready-to-use schemes on my GitHub page https://github.com/asjadnaqvi/Stata-schemes.
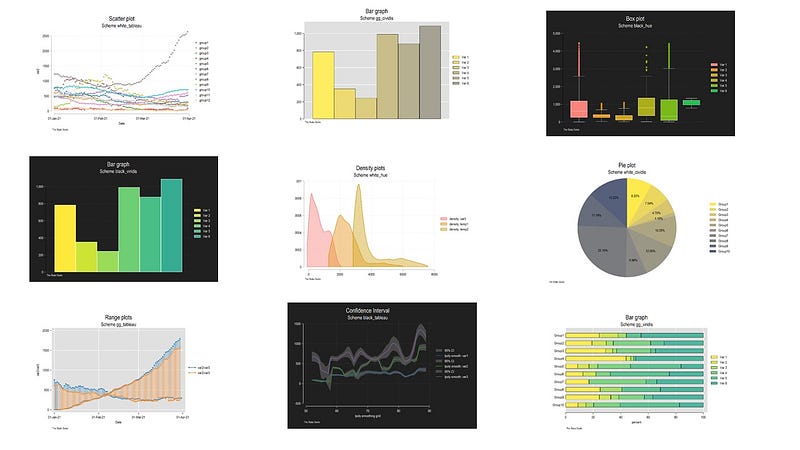
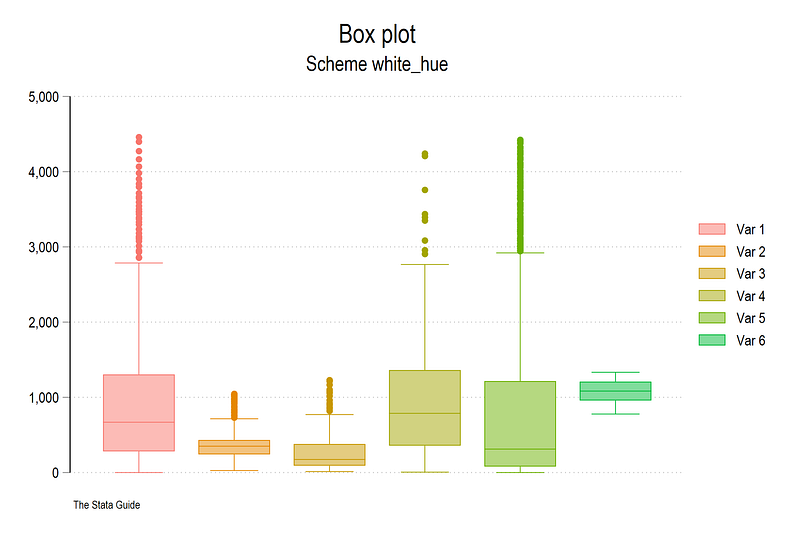
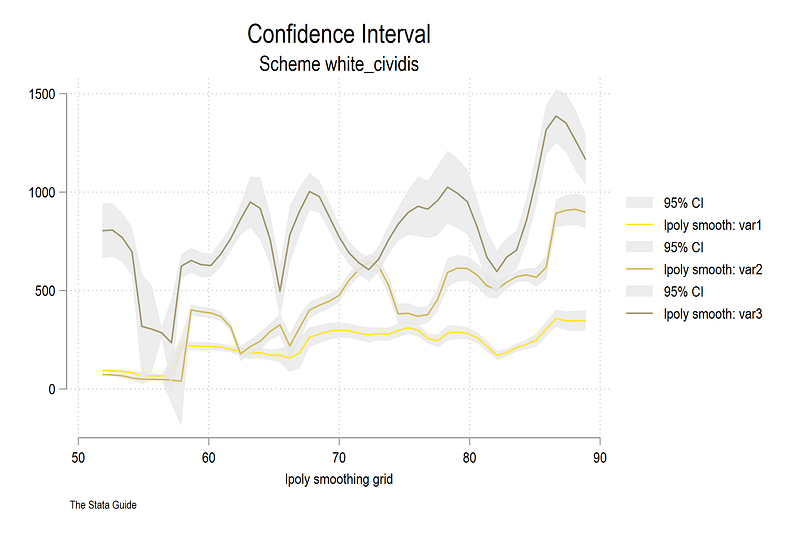
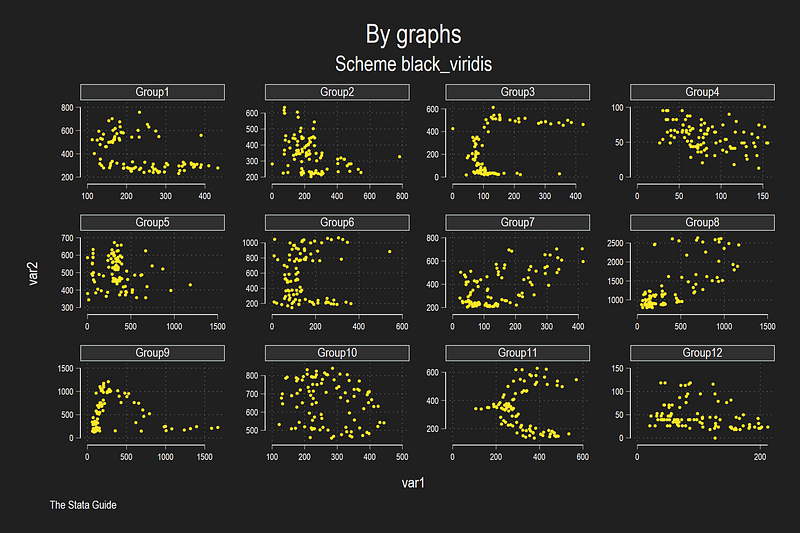
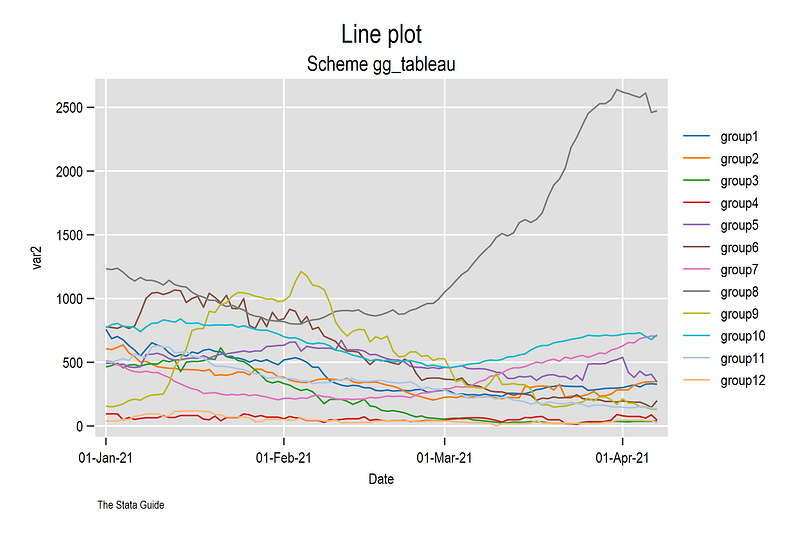
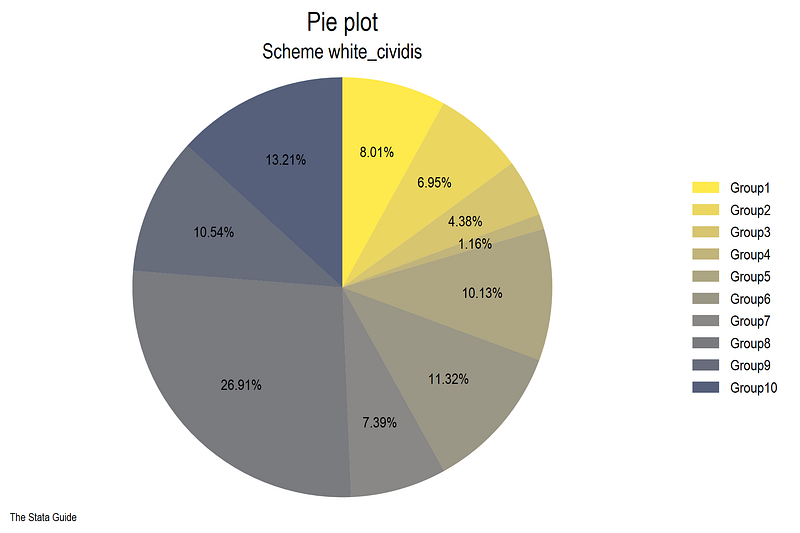
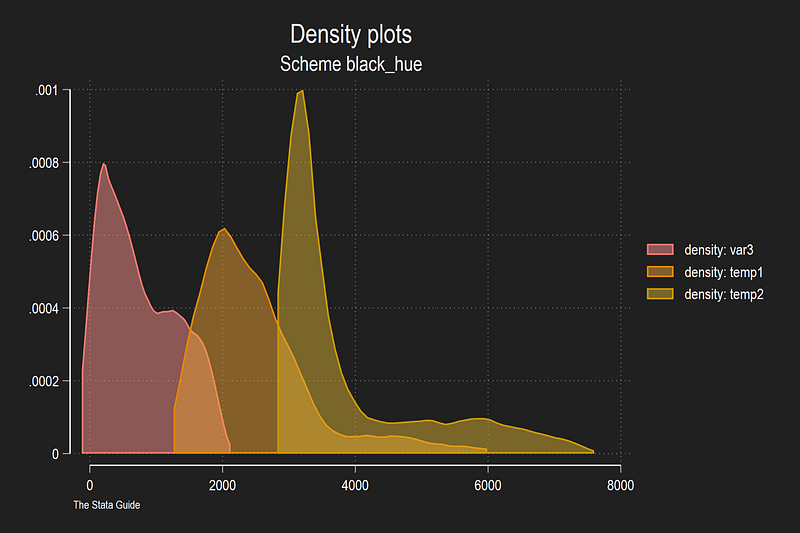
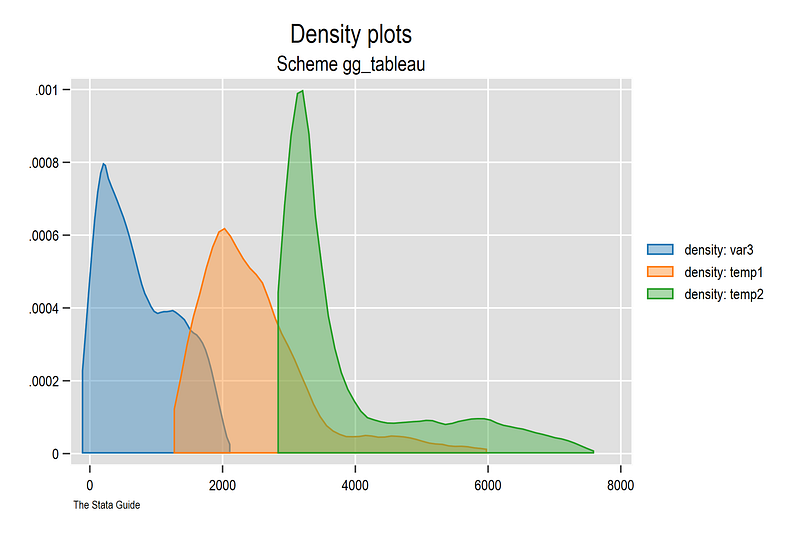
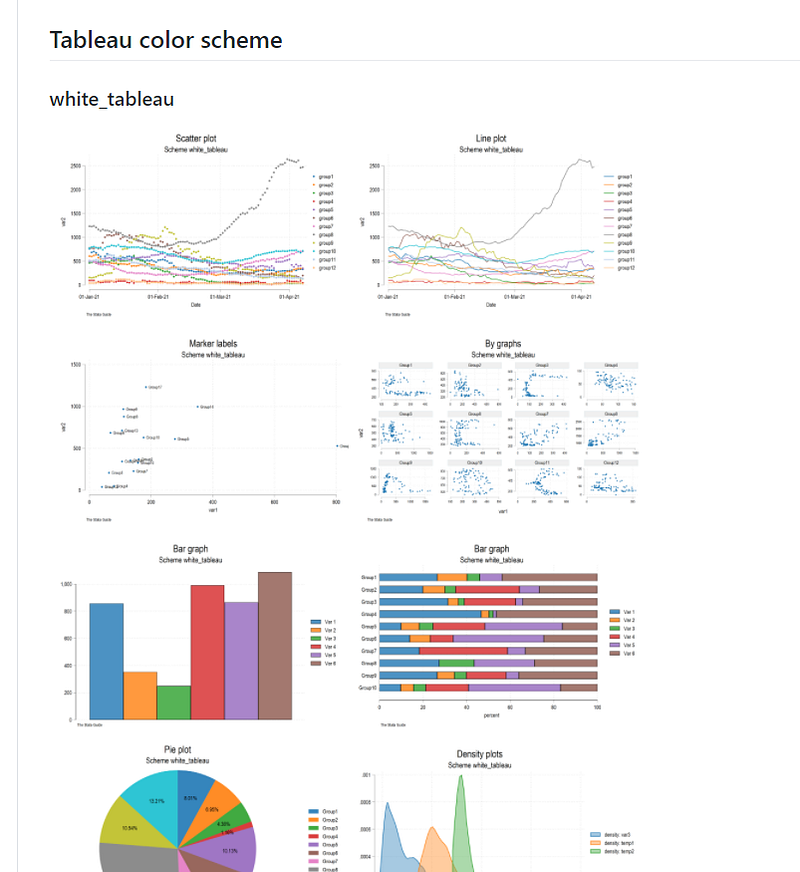
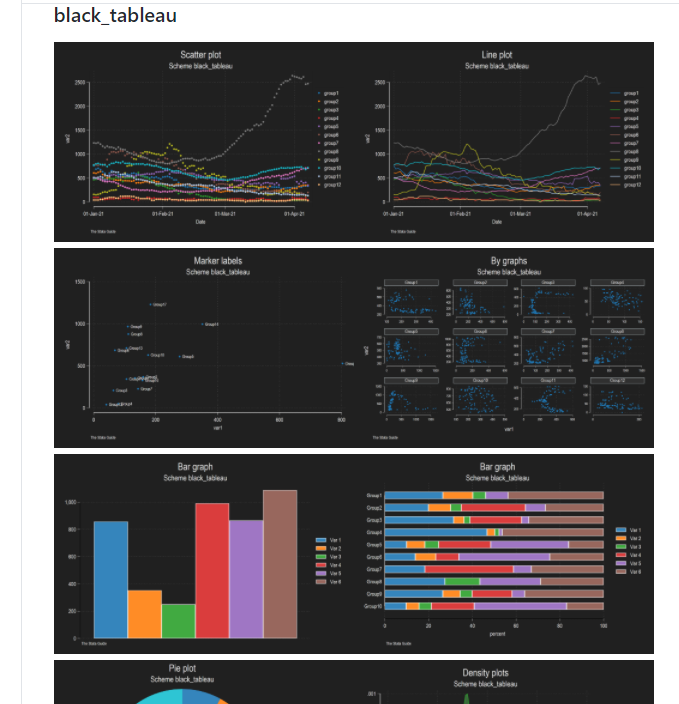
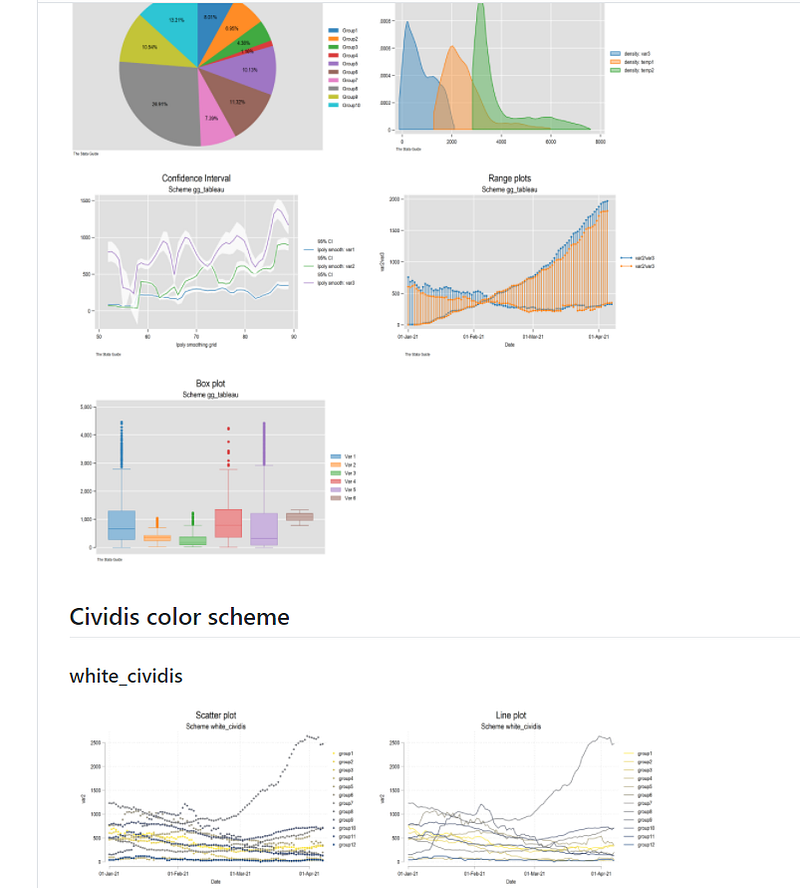
The schemes use the minimalistic elements of the cleanplot scheme and modifies the template to generate three background colors: white, black, and gg (grey):
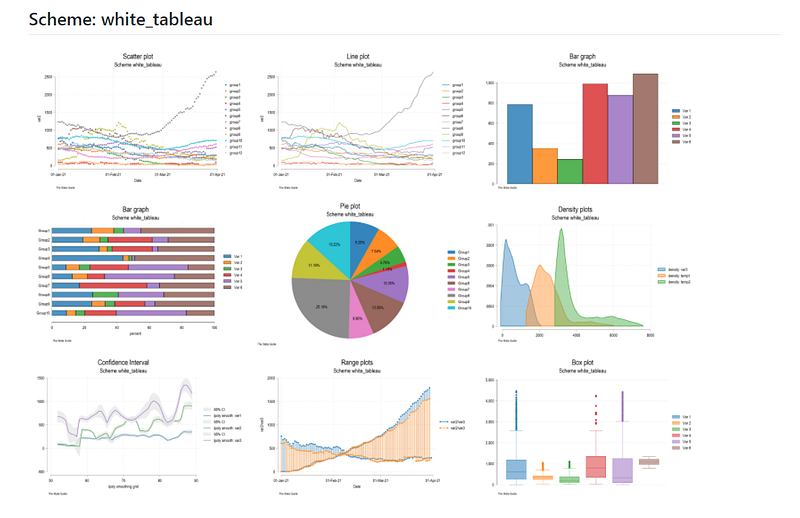
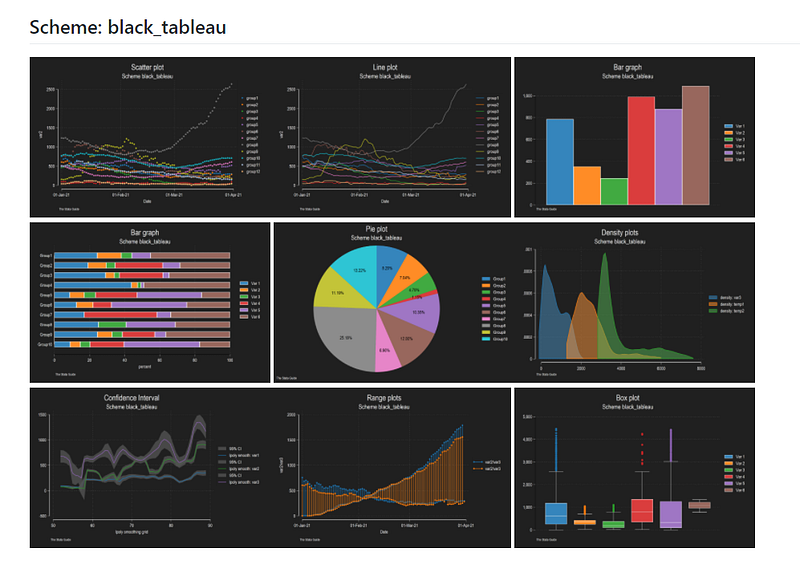

The gg is a replica of the ggplot2 scheme used in R and basically has a grey background with white tick lines. Each background color is combined with a host of different color templates. These schemes are scripted. This means that I replace essential elements in the .scheme file using some code. For example, I script in colors, backgrounds, markers etc.
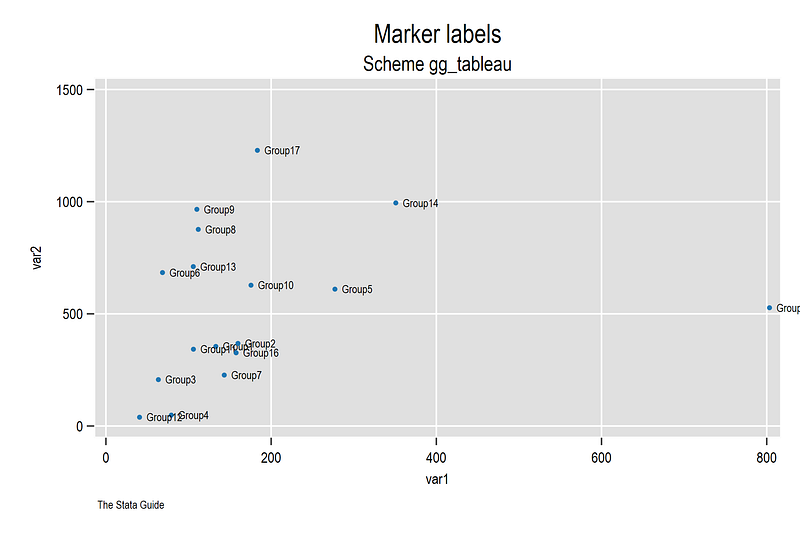
In the screenshots above, one can preview the Tableau color scheme that I have extracted from the colorpalette package.
*ssc install palettes // if you don't have the packagecolorpalette tableau, rows(10)If you are not aware of Tableau, it is one of the leading data visualization softwares used frequently for interactive graphs and charts online.
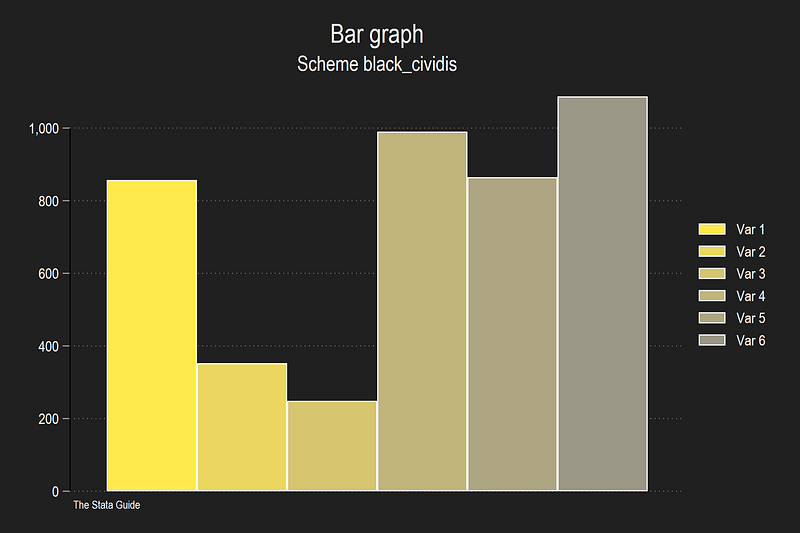
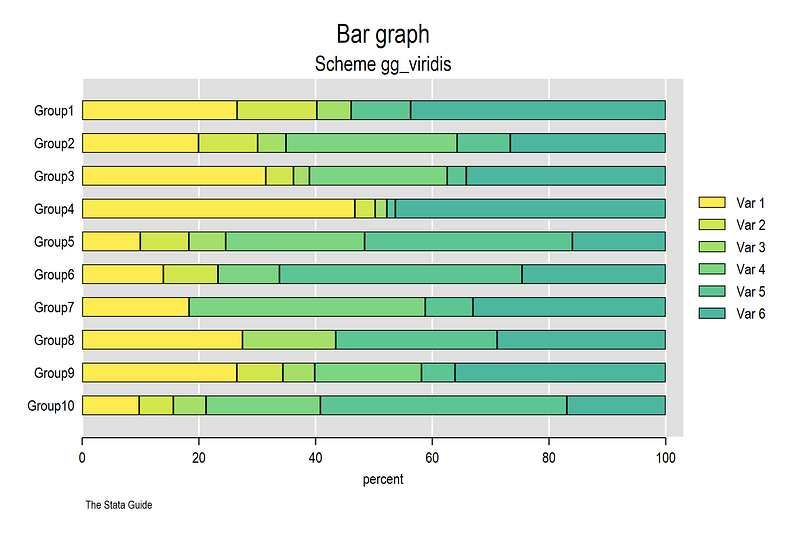
Besides the Tableau, various other color schemes are also introduced:
So how does one get these schemes? The package titled “schemepack” can be installed directly from SSC:
ssc install schemepack, replaceYou can view the GitHub page for more information and can also install the schemes directly from there:
net install schemepack, from("https://raw.githubusercontent.com/asjadnaqvi/Stata-schemes/main/schemes/") replaceThe replace overwrites the earlier versions. The GitHub folder contains a test dataset and a dofile that replicates the graphs in the GitHub folder:
// read the data
use "https://github.com/asjadnaqvi/Stata-schemes/blob/main/scheme_test.dta?raw=true", clear
You can then either set a scheme at the beginning of a dofile as follows:
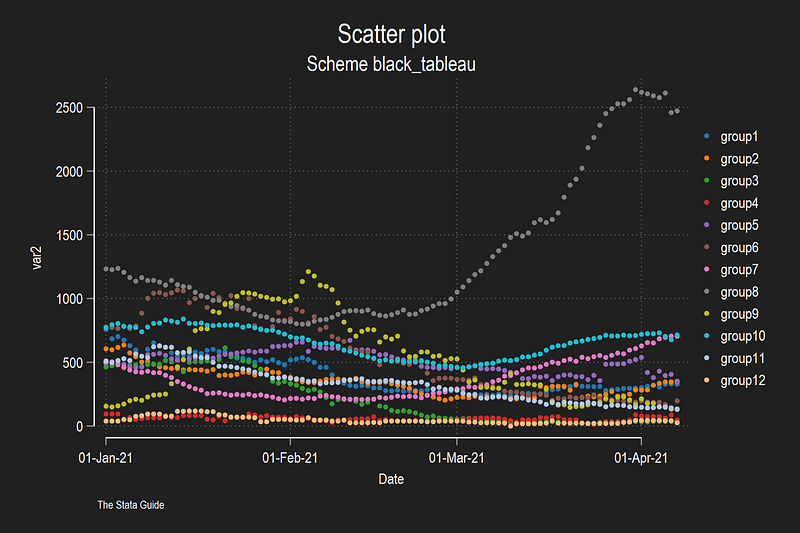
set scheme black_tableauor directly define the scheme in a graph:
twoway ///
 (scatter var2 date if group==1) ///
 (scatter var2 date if group==2) ///
 (scatter var2 date if group==3), ///
scheme(black_tableau)
The dofile provides a bunch of graph commands to generate the figures that are also on GitHub. You can also just use these schemes for your own graphs and projects and test them out.
The scheme names and graph previews are also given on the GitHub page:
Hope you found this guide useful! If you generate your own scheme please let me know as well. Please check on the GitHub page for updates, and please submit errors/bugs you might find. I have tested the standard graphs but once one starts fine-tuning other elements, some color errors might pop up. I will release more schemes and templates over time as well.
About the author
I am an economist by profession and I have been using Stata since 2003. I am currently based in Vienna, Austria where I work at the Vienna University of Economics and Business (WU) and at the International Institute for Applied Systems Analysis (IIASA). You can find my research work on ResearchGate and Google Scholar, and Stata code repository on GitHub. You can follow my COVID-19 related Stata visualizations on Twitter. I am also featured on the Stata COVID-19 webpage in the visualization and graphics section.
You can connect with me via Medium, Twitter, LinkedIn or simply via email: [email protected].
The Stata Guide, releases awesome new content regularly. Clap, and/or follow if you like these guides!


