
Spring Boot 3 Observability With OpenTelemetry Series (Log Monitoring)
Overview of Observability Series So Far
In our Observability Series, we have already covered, Monitoring Metrics and Monitoring Traces with OpenTelemetry and you can refer to the respective articles with the below links.
With today’s approach, we will optimize our existing application developed with Spring Boot by Integrating with Loki, a log aggregation system inspired by Prometheus.
This integration will significantly enhance the logging capabilities of our application, enabling us to effectively manage and analyze logs, increasing visibility, and facilitating system troubleshooting.
Our Approach
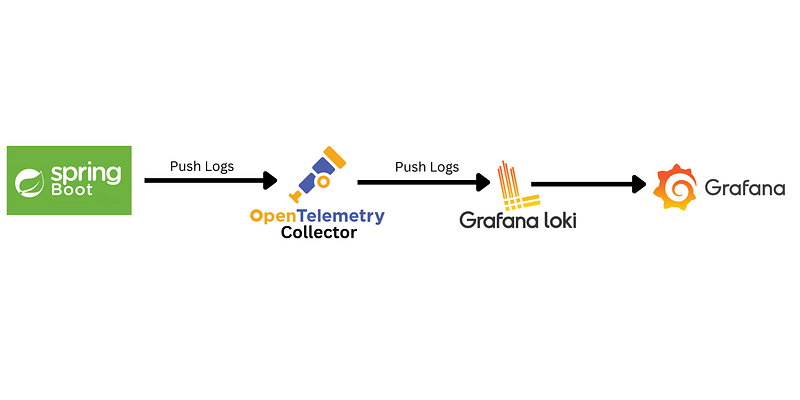
In this tutorial, I’ll show you how to integrate Open Telemetry with Loki and Grafana to achieve observability via enhancing logging capabilities. To learn more about OpenTelemetry please head over to the following Link.
Grafana Loki
Loki is a horizontally scalable, highly available, multi-tenant log aggregation system inspired by Prometheus. It is designed to be very cost-effective and easy to operate. It does not index the contents of the logs, but a set of labels for each log stream.
Compared to other log aggregation systems, Loki:
- No full-text indexing on logs: Loki stores compressed, unstructured logs and only indexes metadata. This makes Loki simpler to operate and cheaper to run.
- Label-based indexing and grouping: Loki Indexes and groups log streams using the same labels used with Prometheus. This enables seamless switching between metrics and logs using the same labels that you’re already using with Prometheus.
- Query Language: Loki provides a query language called LogQL, This enables users to generate queries against the logs. The language also facilitates the generation of metrics from log data, a powerful feature that goes well beyond log aggregation.
- Distributed Architecture: Loki is designed to be horizontally scalable and can run in a distributed architecture. This scalability allows it to handle large volumes of log data in a clustered setup.
- Perfect for the logs of Kubernetes Pods: Loki is an especially good fit for storing Kubernetes Pod logs. Metadata such as pod labels are automatically scraped and indexed.
- Native support in Grafana: Loki Has native support in Grafana (needs Grafana v6.0).
Application Setup with SpringBoot
We will set up the application with Spring Initializer with the following dependencies in the pom.xml file.
<dependencies>
  <dependency>
   <groupId>org.springframework.boot</groupId>
   <artifactId>spring-boot-starter-actuator</artifactId>
  </dependency>

  <dependency>
   <groupId>org.springframework.boot</groupId>
   <artifactId>spring-boot-starter-webflux</artifactId>
  </dependency>

  </dependency>
  <dependency>
   <groupId>io.micrometer</groupId>
   <artifactId>micrometer-registry-otlp</artifactId>
   <scope>runtime</scope>
  </dependency>

  <dependency>
   <groupId>io.micrometer</groupId>
   <artifactId>micrometer-tracing-bridge-otel</artifactId>
   <version>1.1.6</version>
  </dependency>

  <dependency>
   <groupId>io.opentelemetry</groupId>
   <artifactId>opentelemetry-api</artifactId>
   <version>1.31.0</version>
  </dependency>

  <dependency>
   <groupId>io.opentelemetry</groupId>
   <artifactId>opentelemetry-exporter-otlp</artifactId>
   <version>1.31.0</version>
  </dependency>

  <dependency>
   <groupId>io.opentelemetry</groupId>
   <artifactId>opentelemetry-exporter-common</artifactId>
   <version>1.31.0</version>
  </dependency>

  <dependency>
   <groupId>io.opentelemetry.instrumentation</groupId>
   <artifactId>opentelemetry-logback-appender-1.0</artifactId>
   <version>1.31.0-alpha</version>
  </dependency>

  <dependency>
   <groupId>io.opentelemetry</groupId>
   <artifactId>opentelemetry-sdk</artifactId>
   <version>1.31.0</version>
  </dependency>

  <dependency>
   <groupId>io.opentelemetry.instrumentation</groupId>
   <artifactId>opentelemetry-instrumentation-api-semconv</artifactId>
   <version>1.31.0-alpha</version>
  </dependency>

  <dependency>
   <groupId>io.opentelemetry</groupId>
   <artifactId>opentelemetry-exporter-otlp-common</artifactId>
   <version>1.31.0</version>
  </dependency>

</dependencies>
Configuring OpenTelemetry Collector
We will update the configurations related to the OpenTelemetry Collector, including Loki, as an exporter inside the otel-collector.yml file.
receivers:
  otlp:
    protocols:
      http:
      grpc:

processors:
  # batch metrics before sending to reduce API usage
  batch:

exporters:
  logging:
    loglevel: debug
  prometheus:
    endpoint: "0.0.0.0:8889"
    const_labels:
      label1: spring
  otlp:
    endpoint: tempo:4317  # tempo container host and port
    tls:
      insecure: true
  loki:
    endpoint: "http://loki:3100/loki/api/v1/push"

extensions:
  # responsible for responding to health check calls on behalf of the collector.
  health_check:
  # fetches the collector’s performance data
  pprof:
  # serves as an http endpoint that provides live debugging data about instrumented components.
  zpages:

service:
  extensions: [health_check, pprof, zpages]
  pipelines:
    # for now we only interested about metrics...
    metrics:
      receivers: [otlp]
      processors: [batch]
      exporters: [prometheus]
    traces:
      receivers: [otlp]
      processors: [batch]
      exporters: [otlp]  # name here should match the exporter name for tempo which is otlp
    logs:
      receivers: [otlp]
      exporters: [loki,logging]
Configuring Logging Appender
We will customize the logging appender by creating a logback-spring.xml.
<?xml version="1.0" encoding="UTF-8"?>
<configuration>
    <appender name="console" class="ch.qos.logback.core.ConsoleAppender">
        <encoder>
            <pattern>
                %d{HH:mm:ss.SSS} [%thread] %-5level %logger{36} - %msg%n
            </pattern>
        </encoder>
    </appender>
    <appender name="OpenTelemetry"
              class="io.opentelemetry.instrumentation.logback.appender.v1_0.OpenTelemetryAppender">
        <captureExperimentalAttributes>true</captureExperimentalAttributes>
        <captureKeyValuePairAttributes>true</captureKeyValuePairAttributes>
        <captureCodeAttributes>true</captureCodeAttributes>
        <captureMarkerAttribute>true</captureMarkerAttribute>
        <captureMdcAttributes>*</captureMdcAttributes>
    </appender>

    <root level="INFO">
        <appender-ref ref="console"/>
        <appender-ref ref="OpenTelemetry"/>
    </root>

</configuration>
Configurations to push logs to the OpenTelemetry Collector
Create a configuration class to configure Spring boot application to push logs to Open Telemetry Collector.
@Configuration
public class OpenTelemetryConfig {

    @Bean
    OpenTelemetry openTelemetry(final SdkLoggerProvider sdkLoggerProvider, final SdkTracerProvider sdkTracerProvider, final ContextPropagators contextPropagators) {
        final OpenTelemetrySdk openTelemetrySdk = OpenTelemetrySdk.builder()
                .setLoggerProvider(sdkLoggerProvider)
                .setTracerProvider(sdkTracerProvider)
                .setPropagators(contextPropagators)
                .build();
        OpenTelemetryAppender.install(openTelemetrySdk);
        return openTelemetrySdk;
    }

    @Bean
    SdkLoggerProvider otelSdkLoggerProvider(final Environment environment, final ObjectProvider<LogRecordProcessor> logRecordProcessors) {
        final String applicationName = environment.getProperty("spring.application.name", "application");
        final Resource resource = Resource.create(Attributes.of(ResourceAttributes.SERVICE_NAME, applicationName));
        final SdkLoggerProviderBuilder builder = SdkLoggerProvider.builder()
                .setResource(Resource.getDefault().merge(resource));
        logRecordProcessors.orderedStream().forEach(builder::addLogRecordProcessor);
        return builder.build();
    }

    @Bean
    LogRecordProcessor otelLogRecordProcessor() {
        return BatchLogRecordProcessor
                .builder(
                        OtlpGrpcLogRecordExporter.builder()
                                .setEndpoint("http://localhost:4317")
                                .build())
                .build();
    }
}
Running OpenTelemetry Collector Loki and Grafana
We will run the OpenTelemetry Collector, Loki and Grafana with Docker using docker-compose.yaml file as in the following example:
version: '3'
services:
  otel-collector:
    image: otel/opentelemetry-collector-contrib
    restart: always
    command:
      - --config=/etc/otelcol-cont/otel-collector.yml
    volumes:
      - ./collector/otel-collector.yml:/etc/otelcol-cont/otel-collector.yml
    ports:
      - "1888:1888" # pprof extension
      - "8888:8888" # Prometheus metrics exposed by the collector
      - "8889:8889" # Prometheus exporter metrics
      - "13133:13133" # health_check extension
      - "4317:4317" # OTLP gRPC receiver
      - "4318:4318" # OTLP http receiver
      - "55679:55679" # zpages extension

  prometheus:
    container_name: prometheus
    image: prom/prometheus
    restart: always
    command:
      - --config.file=/etc/prometheus/prometheus.yml
    volumes:
      - ./prometheus/prometheus.yml:/etc/prometheus/prometheus.yml
    ports:
      - "9090:9090"

  grafana:
    container_name: grafana
    image: grafana/grafana
    ports:
      - "3000:3000"

  tempo:
    image: grafana/tempo:latest
    command: [ "-config.file=/etc/tempo.yml" ]
    volumes:
      - ./tempo/tempo.yml:/etc/tempo.yml
    ports:
      - "3200:3200"   # tempo
      - "4317"  # otlp grpc

  loki:
    image: grafana/loki:latest
    command: -config.file=/etc/loki/local-config.yaml
    ports:
      - "3100:3100"
Attaching Loki as a Data Source in Grafana
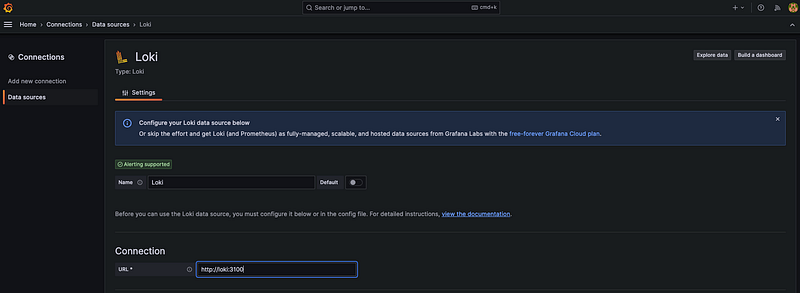
Follow the below steps to set up Loki as a data source in Grafana.
Grafanais accessible via http://localhost:3000/login enter admin as the default username and admin as the default password.- Add Loki as a new data source.
- Configure the data source to connect to our Loki container.
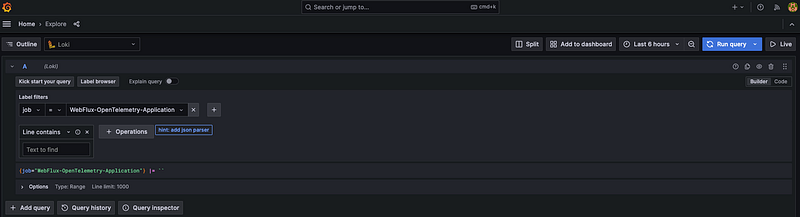
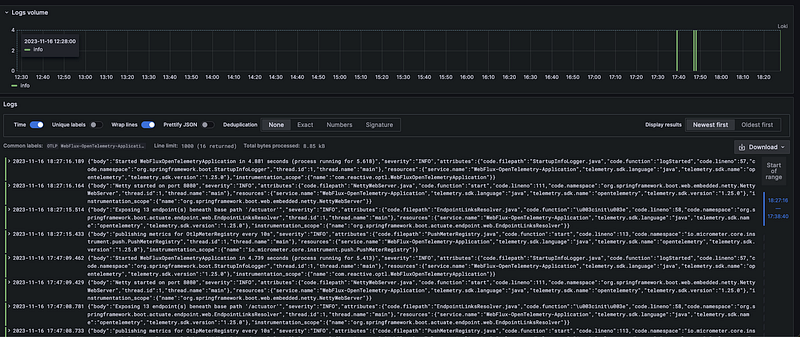
Then You can see the logs as shown below.
Summary
In this article, we have covered:
- What is Grafana Loki
- Configuring Open Telemetry with Loki and Grafana in SpringBoot.
The GitHub repo for the article can be found here.
Please feel free to share your feedback.
Visit to find more of my articles on Medium.
Thanks for reading.
Stackademic
Thank you for reading until the end. Before you go:
- Please consider clapping and following the writer! 👏
- Follow us on Twitter(X), LinkedIn, and YouTube.
- Visit Stackademic.com to find out more about how we are democratizing free programming education around the world.


