
Spark for Big Data
Overview
The news is that Spotify is coming to India. It has many challenges to face with the local rivals but one of the company-specific factors which decide its growth rate in the long term is its exceedance over churn rate.
So what is this churn rate anyway?
A churn rate is the percentage of subscribers to service who discontinue their subscriptions within a given time period. For a company to expand its clientele, its growth rate, as measured by the number of new customers, must exceed its churn rate.
In this article, we will be using Spark to perform scalable data manipulation and machine learning tasks for a subset (128 MB on my local machine) of a large data set (12 GB on Amazon S3).
To follow along in coming sections, please view my GitHub repository for directions and instructions.
Motivation
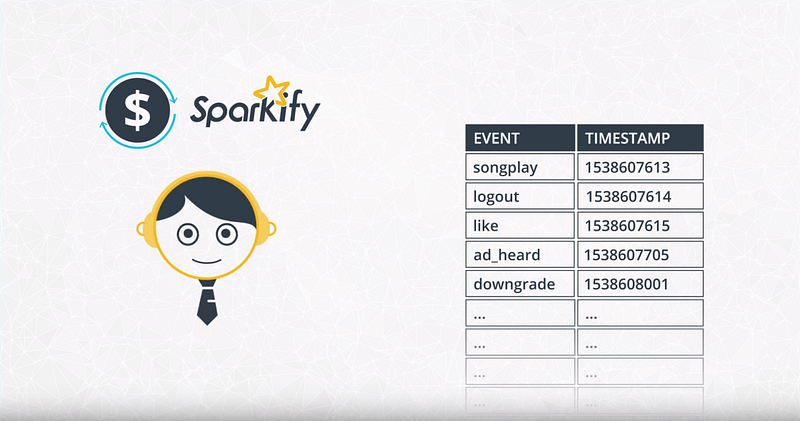
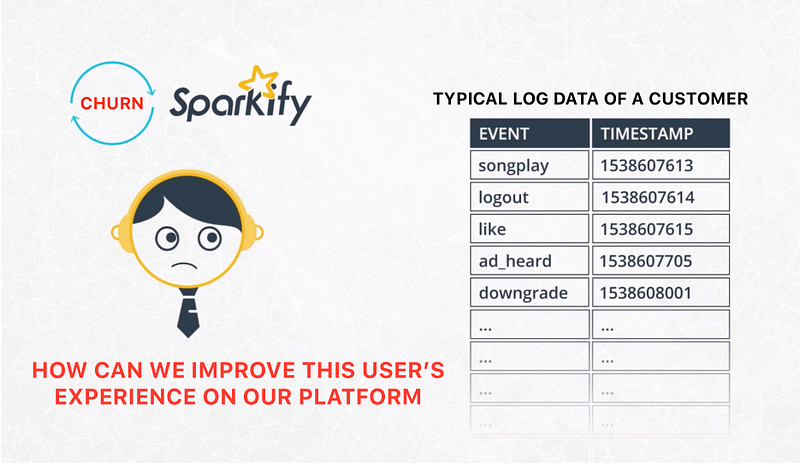
All this data contains the key insights for keeping the users happy and helping the business thrive. It’s the responsibility of the data team to predict which users are at risk to churn: either downgrading from premium to free tier or cancelling their service altogether. If we can accurately identify these users before they leave, then the business can offer them discounts and incentives, potentially saving millions in revenue.
This is one of the Capstone projects that I opted for Udacity’s Data Scientist Nanodegree program.
I have been using scikit-learnfor more than a year now, but with Spark and its functional programming paradigm, we can scale our model for Big Data.
Data Source
Every time a user interacts with the service: whether playing songs, logging out, liking a song with a thumbs up, hearing an ad or downgrading their service, it generates data.
You can download the data set from GitHub(size is 128 MB), and know more about the features from the metadata file. If you want to extend this analysis and deploy your own Spark cluster on Amazon EMR (Elastic MapReduce), comment below and I will share the S3 bucket for the full data set(12GB).
Feature Engineering
Following user-level features were created from the existing ones:
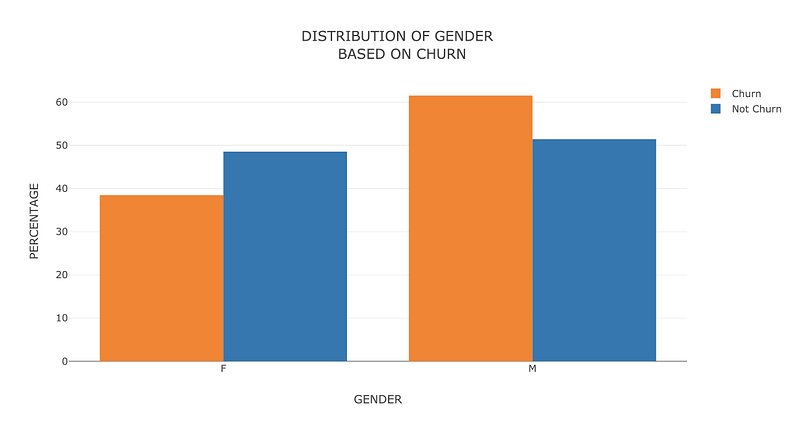
- Dummy columns for gender
2. Songs per user
3. Sessions per user
4. Songs per session for each user
5. Average time per session for each user
6. Most recent status of the user: Free or Paid
7. The proportion of page visits for each user
To know more about the features mentioned above, see the metadata file.
8. Number of artists user has listened to
9. Region-level location information
Modeling
This is a binary classification task. I have used 3 classification algorithms from PySpark’s ml.classification library:
- Logistic Regression
- Ensemble methods like Random Forest Classifier, and
- Gradient Boosting Tree Classifier
and some are still in development.
Improvement
Since the data is highly imbalanced, accuracy is not the right metric for evaluation. Instead, I used the F1 score and performed undersampling to further optimize it.
GBTClassifier provided a fairly good F1 score of 0.64 after undersampling. This post explains why you should use F1 score for evaluating your model on an imbalanced data set.
Analyzing Important Features
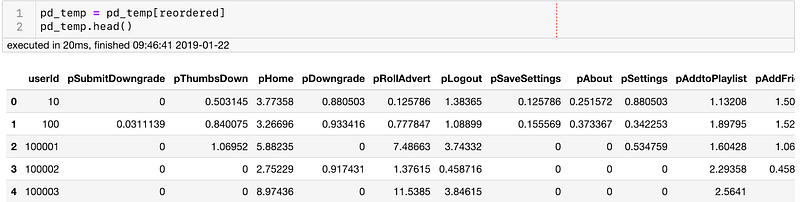
Using featureImportances method from pyspark.ml.GBTClassifier shows the relevance of each feature used in training.
pSubmitDowngrade is at the top because it is somewhat correlated with the target label.
Features that start with “p” are different types of pages the user visited.
Conclusion
I enjoyed the data pre-processing part of the project. For data visualisation part, instead of using “for” loops to get arrays for our bar chart, I first converted our Spark data frame to Pandas data frame using toPandas()method. Data visualisation is easier from then on.
The shape of our final data is just 225 x 32. This is too small to generalise our model. Just 225 users for a streaming company? That’s nothing. 12 GB data might provide some useful results. If you want more statistically significant results then I suggest you run this notebook on Amazon EMR for the 12 GB dataset. I have skipped that part for now because it costs $30 for one week.
Some of the challenges which I faced in this project are:
- Official documentation of PySpark as compared to Pandas
- For the sake of mastering Spark, we only used the most common machine learning classification models instead of using the advanced ones
- Highly imbalanced data led to a poor F1 score
- If you run this notebook without any changes, then it will take around an hour to run completely
Acknowledgements
Thanks to Udacity and Udacity India for providing such a challenging project to work on. At first, I was vexed with functional programming in Python, but the instructors were very clear in their approach. Now I am looking for more projects that are built atop Spark.