
Someone believes that the VIX index will reach 150 by March 2023.
A mysterious trader buys 50,000 VIX call options with a 150 strike expiring in March 2023. Quick study in Python.

Someone out there believes that the worst is yet to come in the financial markets. An unknown trader purchased 50,000 contracts of VIX call options with a strike of 150, expiring late March 2023, shortly before the market closed on October 6th. Supposedly, each contract at the time of purchase was worth 50 cents, hence the trader spent 2.5 million dollars (50,000 contracts x 100 x .50).
Here it is, please refer to the ‘openInterest’ column.

Sometimes called “fear”, the VIX is the most widely referenced measure of expected near-term stock market volatility. It tracks how much investors are currently willing to pay for volatility in a particular market over the coming 30 trading days, using a weighted average of options contract prices from the S&P 500 index. In other words, VIX is used to help gauge investor sentiment and determine how nervous they are about that asset’s future price movements.
Open Interest refers to a number of contracts that are currently held by traders or investors.
Is it possible for the VIX to reach 150 by the end of March 2023? Well, first, let’s see how the VIX has historically behaved during times of peak volatility and how the majority of traders/investors perceives risk today.
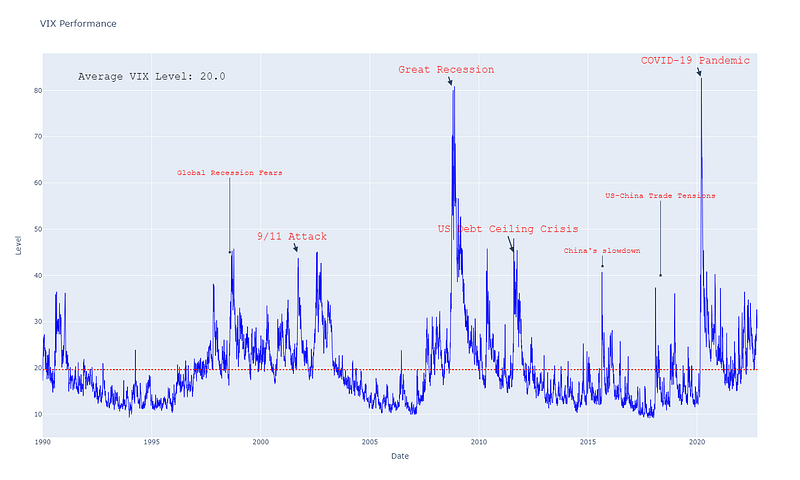
The chart below depicts the historical VIX performance since its inception, as well as the events that resulted in a significant increase in its level. As we can see, the highest point reached by VIX was 82 during the pandemic in 2020, which is comparable to the Great Recession (as a result of the subprime mortgage crisis).
The VIX was nowhere near this high during the current challenging global economic conditions caused by COVID, the Russia-Ukraine conflict, supply chain disruptions, high inflation, fears of a global recession, and risks of financial market dislocation. Perhaps we can say that the VIX index may have gone into hibernation during these severe market declines.
According to below data, the majority of open interest in the late March expiration is concentrated in the 75.0 Call contract, which is exactly halfway between the prediction of the mysterious trade. Most traders base their predictions on the historical level of VIX, which peaked slightly above 80 during previous volatile events.

The put/call open interest ratio for the March expiration date is 0.14, indicating a pessimistic long-term sentiment. The ratio suggests that traders are buying more calls than puts, speculating that the VIX will remain elevated.
If we look at the overall put/call open interest ratio across all expiration dates, it equals to 0.35. Slightly higher but still fairly pessimistic.
And which strikes currently have the most open interest across all expiration dates?


Interestingly, many traders believe that the VIX will reach a 50-level by November 16th, indicating that the VIX is about to wake up. Others believe that in less than two weeks, the VIX will fall to 25 strike by October 19th, implying that the VIX will continue to hibernate. At the time of writing, the VIX is trading around the 31-point mark. We should also mention that some of these positions may have been part of strategy trades in which both sides (put and call) were traded — skewing the open interest ratio between put and call in this comparison.
So, will the enigmatic trader be correct? Although it seems unlikely, anything is possible in the financial markets. In the past, there have been some extreme anomalies that everyone thought would never happen.
It is extremely likely that this trade was a part of some hedging strategy.
Thank you for reading.
Disclaimer: The information contained in this blog post is strictly for educational and entertainment purposes only. This is also not an investment advice. All views expressed in this blog are my own and do not represent the opinions of any entity whatsoever with which I have been, am now, or will be affiliated.
#PYTHON CODE #importing all librariespip install yfinance
import yfinance as yf
import pandas as pd
import seaborn as sns
import plotly.graph_objects as go
import datetime#getting options data for March expirationVIX= yf.Ticker('^VIX')
VIX.options
option = VIX.option_chain(VIX.options[9])
march_calls = option.calls
march_puts = option.puts#getting 150 strike out of dataframemarch_calls[march_calls['strike'] == 150]#calculating Open Interest ratio for March expiration date march_calls_sum = march_calls['openInterest'].sum()march_puts_sum = march_puts['openInterest'].sum()round(march_puts_sum / march_calls_sum, 2)#obtaining maximum Open Interest for puts and call for March expiration datemarch_calls[march_calls.openInterest == march_calls['openInterest'].max()]march_puts[march_puts.openInterest == march_puts['openInterest'].max()]#getting data for all VIX expiration dates #calls: calls_bucket = []
for i in range(0, len(VIX.options)):
option = VIX.option_chain(VIX.options[i])
calls_bucket.append(option.calls)df_calls = pd.concat(calls_bucket)#puts: puts_bucket = []
for i in range(0, len(VIX.options)):
option = VIX.option_chain(VIX.options[i])
puts_bucket.append(option.puts)df_puts = pd.concat(puts_bucket)#calculating Open Interest across all expiration dates vix_calls_sum = df_calls['openInterest'].sum()
vix_puts_sum = df_puts['openInterest'].sum()
round(vix_puts_sum/vix_calls_sum, 2)#Generating the VIX Performance chart df = yf.download('^VIX')fig = go.Figure(data=[go.Scatter(x=df.index, y=df['Close'], name = 'VIX', line = dict(color = 'blue', width =1))])mean_stock_price = df['Close'].mean()fig.add_hline(y=mean_stock_price, line = dict(color = 'red', width =2),line_dash = 'dot')fig.add_annotation(x=datetime.datetime(1995,1,1).timestamp() * 1000, y=83,text=f"Average VIX Level: {round(mean_stock_price, 0)}", showarrow=False,font=dict(size=20, color="black", family="Courier New, monospace"))fig.add_annotation(x=datetime.datetime(2008,10,1).timestamp() * 1000, y=81,text="Great Recession",showarrow=True, arrowhead=2,arrowwidth=2,arrowsize=1, font=dict(size=20, color="red", family="Courier New, monospace"))fig.add_annotation(x=datetime.datetime(2020,3,1).timestamp() * 1000, y=83,text="COVID-19 Pandemic",showarrow=True, arrowhead=2,arrowwidth=2,arrowsize=1, font=dict(size=20, color="red", family="Courier New, monospace"))fig.add_annotation(x=datetime.datetime(2001,9,1).timestamp() * 1000, y=45,text="9/11 Attack",showarrow=True, arrowhead=2,arrowwidth=2,arrowsize=1, font=dict(size=20, color="red", family="Courier New, monospace"))fig.add_annotation(x=datetime.datetime(2011,8,1).timestamp() * 1000, y=45,text="US Debt Ceiling Crisis", showarrow=True, arrowhead=2,arrowwidth=2,arrowsize=1, align="left", yanchor='bottom', font=dict(size=20, color="red", family="Courier New, monospace"))fig.add_annotation(x=datetime.datetime(2018,5,1).timestamp() * 1000, y=40,text="US-China Trade Tensions",showarrow=True,arrowhead=7, ax=0,ay=-150,font=dict(size=15, color="red", family="Courier New, monospace"))fig.add_annotation(x=datetime.datetime(2015,9,1).timestamp() * 1000, y=42,text="China's slowdown",showarrow=True, arrowhead=7,ax=0, font=dict(size=15, color="red", family="Courier New, monospace"))fig.add_annotation(x=datetime.datetime(1998,8,1).timestamp() * 1000, y=45,text="Global Recession Fears",showarrow=True,arrowhead=7,ax=0, ay=-150,font=dict(size=15, color="red", family="Courier New, monospace"))fig.update_yaxes(title_text="Level")fig.update_xaxes(title_text="Date")fig.update_layout(title="VIX Performance")fig.update_layout(height=900, width=1500,showlegend=False)fig.show()Subscribe to DDIntel Here.
Visit our website here: https://www.datadriveninvestor.com
Join our network here: https://datadriveninvestor.com/collaborate