
Score Big with Python! : Analyzing IPL Cricket Data and Creating an Eye-Catching Stacked Bar Chart
How to Set Up Python for IPL Analytics: A Step-by-Step Guide

Cricket is one of the most popular sports in the world, and the Indian Premier League (IPL) has emerged as a global phenomenon, attracting millions of fans from all over the world. With the increasing availability of data and tools, there has never been a better time to analyze IPL data and gain insights into the game. In this article, we’ll show you how to set up Python for IPL analytics, from data collection to analysis, using open-source libraries and tools.
Step 1: Collecting IPL Data
The first step in analyzing IPL data is to collect the relevant data. Do you know where to find IPL data? You can find it on official IPL websites or third-party websites such as ESPNcricinfo. In this example, we’ll use data from the Kaggle IPL dataset, which includes detailed ball-by-ball data for all IPL matches.
Step 2: Installing Python and Required Libraries
Once you have the data, the next step is to install Python and the required libraries for data analysis. We’ll be using the Anaconda distribution of Python, which includes popular data analysis libraries such as NumPy, Pandas, and Matplotlib. To install Anaconda, simply download the installer from the Anaconda website and follow the installation instructions.
Step 3: Loading IPL Data into Python
With Python and the required libraries installed, the next step is to load the IPL data into Python. We’ll be using the Pandas library to load the data into a DataFrame, which is a popular data structure for data analysis in Python. Here’s some sample code to load the Kaggle IPL dataset into a Pandas DataFrame:
import pandas as pd

ipl_data = pd.read_csv('https://github.com/opencv/cricket-analytics/blob/master/IPL-Dataset-2008-2017.csv?raw=true')
Step 4: Cleaning and Preparing the Data
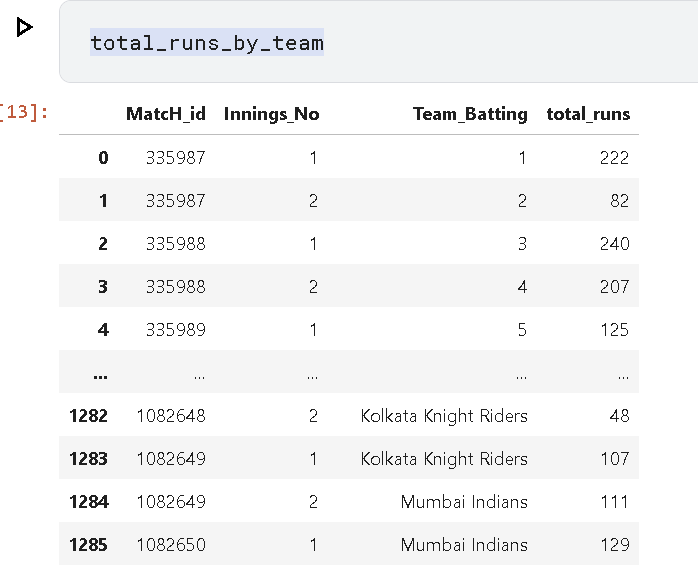
Once the data is loaded into Python, the next step is to clean and prepare the data for analysis. This may involve removing missing values, transforming data types, and creating new variables. In this example, we’ll create a new variable for the total runs scored by each team in each match:
ipl_data['total_runs'] = ipl_data['batsman_runs'] + ipl_data['extra_runs']
total_runs_by_team = ipl_data.groupby(['match_id', 'inning', 'batting_team'])['total_runs'].sum().reset_index()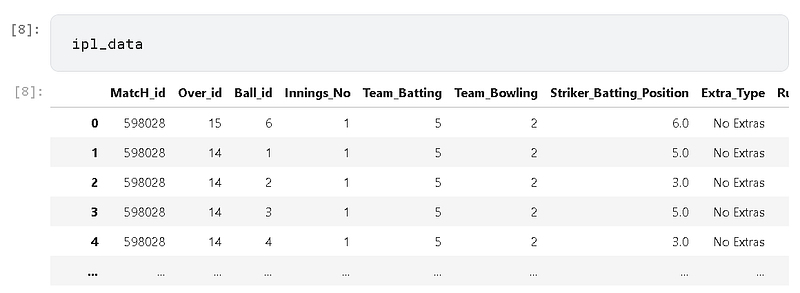
Step 5: Analyzing the Data
With the data cleaned and prepared, the final step is to analyze the data and gain insights into the game. There are several tools and libraries available for data analysis in Python, including Matplotlib and Seaborn for visualization, and Scikit-learn for machine learning. In this example, we’ll use Matplotlib to create a complex chart of the total runs scored by each team in the IPL, broken down by innings and match result:
import matplotlib.pyplot as plt
import numpy as np

# create a pivot table of total runs by team, inning, and match result
total_runs_pivot = pd.pivot_table(total_runs_by_team, values='total_runs', index=['batting_team'], columns=['inning', 'match_id'], aggfunc=np.sum)

# create a stacked bar chart of total runs by team, inning, and match result
fig, ax = plt.subplots(figsize=(12, 8))
bar_width = 0.35
opacity = 0.8
colors = ['#004ba0', '#ff7f0e', '#2ca02c', '#d62728']

for i, team in enumerate(total_runs_pivot.index):
    total_runs = total_runs_pivot.loc[team].values
    match_results = ['Won', 'Lost', 'Tied', 'No Result']
    bar_positions = np.arange(len(match_results)) + i * bar_width
    ax.bar(bar_positions, total_runs, bar_width, alpha=opacity, color=colors[i % len(colors)], label=team)

# add some labels and titles to the chart
ax.set_xlabel('Match Result')
ax.set_ylabel('Total Runs')
ax.set_title('Total Runs by Team in the IPL')
ax.set_xticks(np.arange(len(match_results)) + bar_width / 2)
ax.set_xticklabels(match_results)
ax.legend()

plt.show()
This code creates a stacked bar chart of total runs by team, inning, and match result. The chart shows the total runs scored by each team in the IPL, broken down by innings and match result. Each bar in the chart represents a team, and the different colors represent the innings and match result. The chart provides a visual representation of the performance of each team in the IPL, and can be used to gain insights into the game.
Feel free to reach out incase of any questions on this.
You might also like this
https://readmedium.com/how-to-query-json-objects-in-mysql-dab878c37aeb?
About the author
Srihari Pramod
Design | NoCode | AI Products | Data analytics
LinkedIn : https://www.linkedin.com/in/sriharipramod/
P.S.: If you like to experience Medium yourself, consider supporting me and thousands of other writers by signing up for a membership. It only costs $5 per month, it supports me directly with a portion of your fee, it won’t cost you more!