
Presenting Scientific Data — The Ultimate Guide

If you are working on a manuscript that requires graphics, I mean tables, figures, and graphs, go through this entire tutorial. I’m sure after following this, your paper graphics will look professional and attractive.
In this tutorial, we will cover
- Philosophy of graphics in scientific writing
- Use of tables in scientific presentation
- Use of figures in scientific writing
- Use of colours in scientific illustration
- Ultimate free tools for graphics designing
- Demos for using these tools
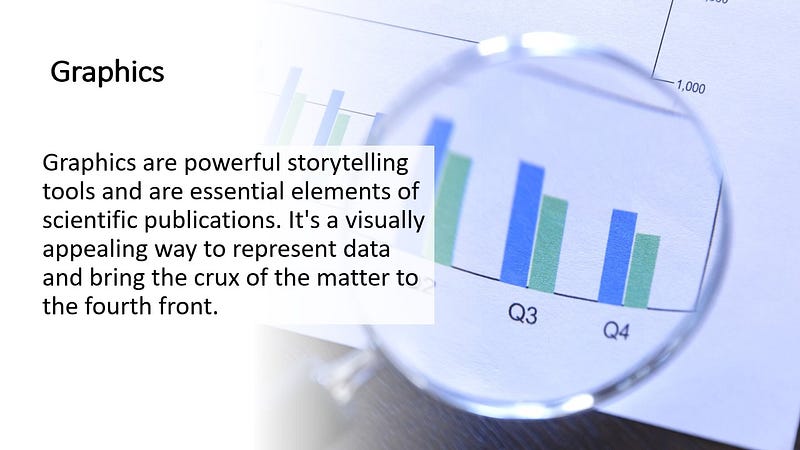
Philosophy of Graphics in scientific writing
Graphics are worth of thousand words. It helps the reader to understand the article and reduces the word count. Readers usually start by reading figures and tables before reading the text. Therefore, figures and tables should be easy to follow and attract attention. Despite its importance, it generally falls short of the journal’s standards. This tutorial is developed to help the authors to design good-quality graphics for scientific publications.
Graphics should be autonomous, which means they should be fully understandable even outside of the context of the article or abstract. A good way to test if an illustration can really stand on its own is to ask someone new to the domain to interpret it without reading the text of the article. Good graphics are easy to interpret, shorten the reading time, reduce the number of words in the main text and save space. However, there is a limit on how many should be included. Graphics should not account for more than one-third of the manuscript. Likewise, reds and greens should not be paired, to accommodate colour-blind readers.
Why do we need graphics in a research article?
- Represent complex data and relationships in a way that is easier to interpret and understand
- Reduce reading time by summarizing and highlighting key findings or trends so they are easily visible
- Reduce the total number of words count and save the publication space
Types of graphics used in scientific publications
Many types of graphics are used, however, the ultimate goal is reader understanding. After selecting the parameters, the graphics format should be carefully selected. With the wrong choice, the graphics will not be understood by the readers. The most commonly used graphic formats are;
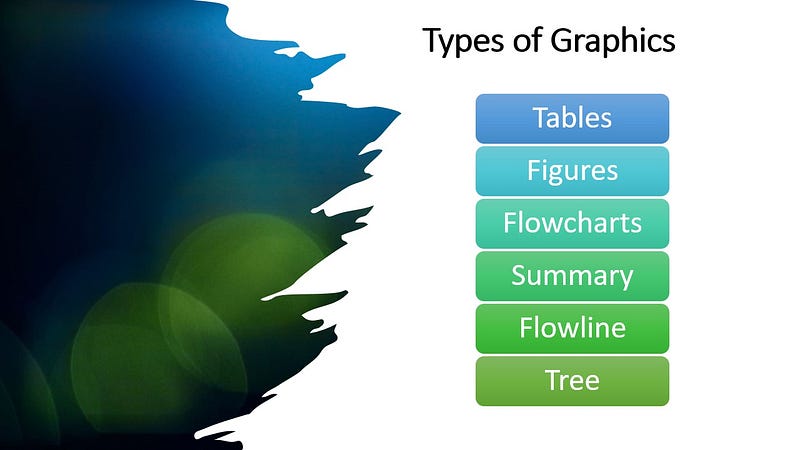
- Tables
- Figures
- Flowcharts
- Summary
- Flowline
- Tree
Copyright of figures in scientific publications
Figures are used in three ways in scientific publications;
- Original graphics: Graphics designed and developed by authors for their current article.
- Reproduce graphics: Graphics copied from other studies or the internet.
- Adopted graphics: Graphics copied and changed to be adjusted in the new study.
Always use your original miniatures. The other two categories lie in plagiarism. Therefore, always avoid them. In case you need to use them in your study, take the appropriate copyright from the publishers.
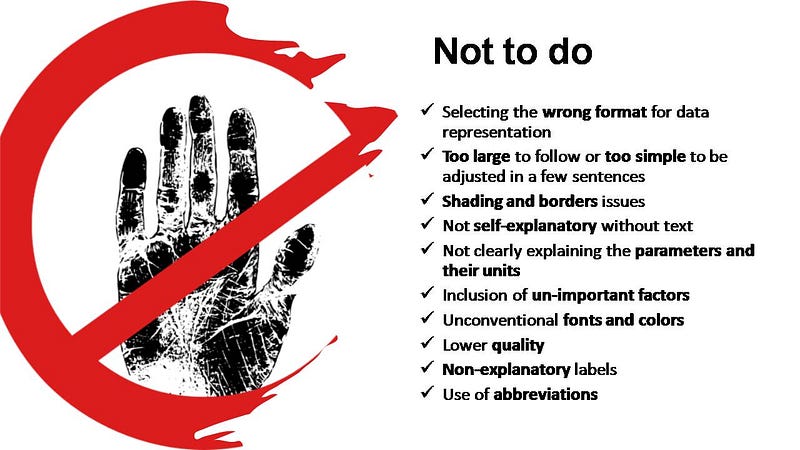
What not to do with graphics in scientific publications
- Selecting the wrong format for data presentation
- Too large to follow or too simple to be adjusted in a few sentences
- Wrong shading and borders
- Not self-explanatory without text
- Parameters and their units are not clearly explained
- Inclusion of non-important parameters
- Unconventional fonts and colours
- Lower quality figures
- Non-explanatory captions
- Use of abbreviations
What to do with graphics in scientific publications
- Is it really needed to be presented in the graphics format?
- Every graphic should provide the necessary information
- First, select the necessary information then select the best graphics method
- Understandable without text
- Should not include long sentences
- Graphics should not account for more than one-third of the manuscript
- Must have accuracy and clarity
- Parameters are supported by units
- Graphics must be referred to in the text (sequentially)
- Check if the graphics used are effective or not.
- Is everything readable?
- Proofread the work for typos
Captions
- A clear and concise caption
- Avoid using the abbreviation in the caption
- If parameters units are not explained in the columns and there is a space, explain them in the caption
- Include experimental detail
The above discussion shows that readers first read the article figures, before starting the rest of the article. Therefore, it is extremely necessary that you must follow to above-listed pieces of advice to attract and hook the readers.


