
[Financial War] Russia’s Strategic Shift: Selling US Treasuries for Gold Reserves and Is China Following Suit?
Introduction
In recent years, Russia has made strategic moves to protect its economy from the looming threat of Western sanctions. One of the most significant developments in this regard has been the Kremlin’s decision to reduce its holdings of US Treasuries while increasing its gold reserves. This shift in Russia’s foreign exchange reserves strategy began in the 2010s and culminated in a substantial increase in gold holdings until 2020. (Yiu, 2022)
Russia’s Timeline of Dumping Actions
The process of selling US Treasuries and acquiring gold reserves by Russia can be divided into several key phases:
Initial Shift (2013–2016): Russia’s foreign exchange reserves began to decrease from their peak of over $160 billion in 2012 to about $100 billion in 2017. This initial reduction in US Treasuries by about 40% was partly a response to sanctions imposed after Russia’s annexation of Crimea.
Second Stage (2018): In 2018, it was reported that “Russia liquidated more of its holdings [of US Treasuries] and disappeared entirely from the TIC’s list of the 33 largest foreign holders of Treasuries.” (Richter, 2018) Russia’s holdings have plunged from more than $100 billion to $14.9 billion in May 2018, a 85% cut in one year!
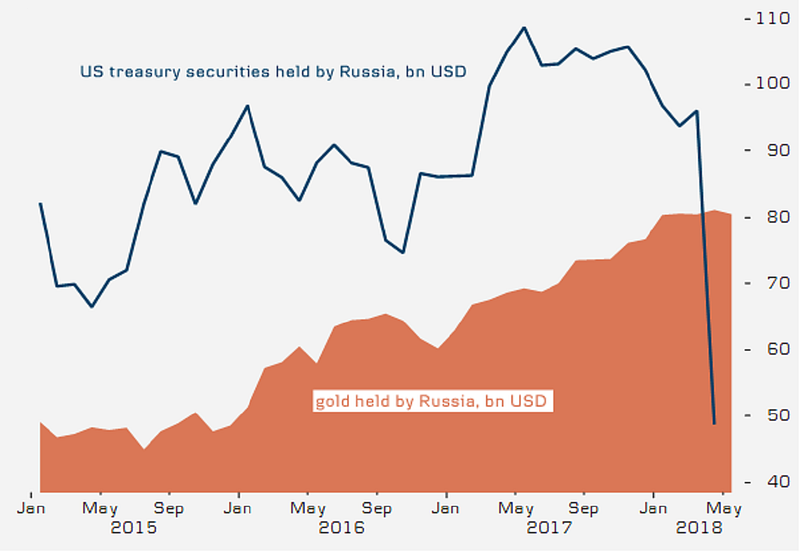
Bloomberg’s Doff (2018) provides the following chart (Figure 2) showing that Russia was dumping Treasuries to hold more gold as reserves.
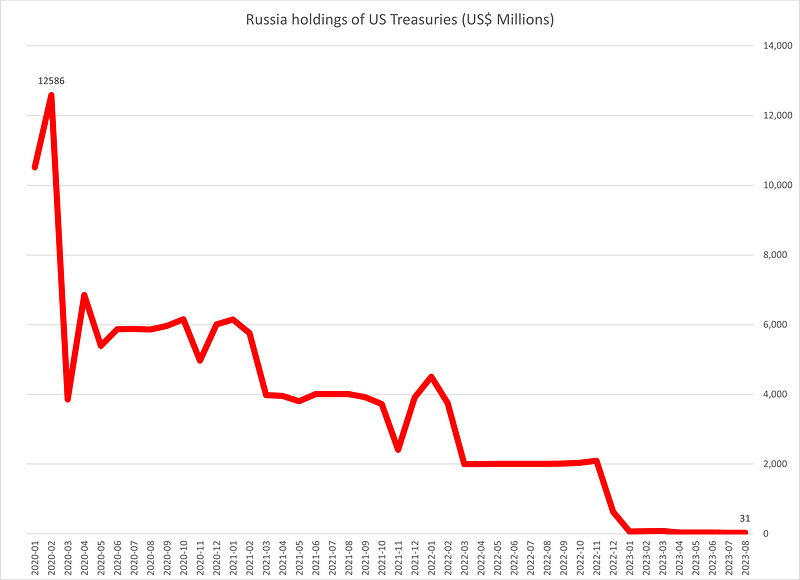
Third Stage (2020-2022): Russia took another sharp cut of US Treasuries in 2020 from $12.6 billion to about $4 billion in 2021, another 65% reduction in 1-year (Figure 3).
Fourth Stage (2022): Before the Russia-Ukraine war, which is referred to as a “special military operation” by Russia, commenced in February 2022, Russia’s holdings of US Treasuries went through successive reductions, dwindling from $4 billion to $2 billion, and eventually nearly depleting to just $31 million by August 2023 (Figure 3).
Russia’s Timeline of Hoarding Actions
Gradual Gold Accumulation (2010–2014): The Russian central bank’s gold holdings increased steadily during this period from less than 500 tons to more than 1000 tons, a more than 100% increase.
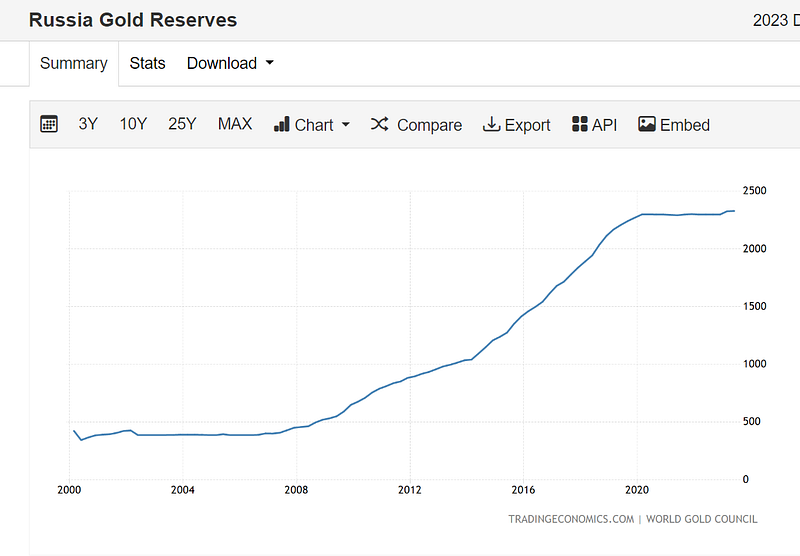
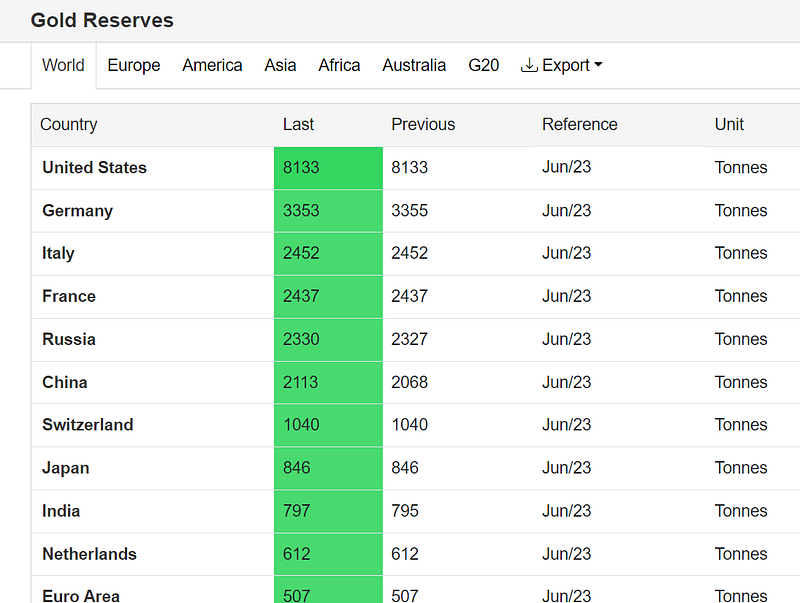
Accelerated Gold Buying (2015–2020): In this phase, Russia significantly increased its gold reserves from 1000 tons in 2015 to more than 2300 tons in 2020, another 130% increase (Figure 4). By June 2022, Russia’s gold reserves reached approximately 2,330 tons, making it the fifth-largest holders of the precious metal (Figure 5).
Implications of the Strategy
Sanctions Resilience: The increased gold reserves offer Russia a degree of protection against the impact of sanctions. Gold is not subject to financial restrictions in the same way that assets held in foreign currencies, such as US Treasuries, can be frozen.
De-dollarization: Reducing reliance on US assets, including Treasuries, aligns with Russia’s broader de-dollarization goals. By holding less US debt, Russia is less vulnerable to the economic leverage that the United States has through its control of the global financial system.
Economic Stability: A significant gold reserve can help stabilize Russia’s economy by providing a valuable asset that can be used to trade with international trading partners and may be able to support the value of the ruble in times of financial or political turmoil.
Is China following Russia’s Lead?
Following Russia’s strategic shift to sell US Treasuries and increase its gold reserves as a safeguard against sanctions and economic instability, the international community is closely watching China’s moves in the global financial landscape. China, as the world’s second-largest economy and a key holder of US Treasuries, holds the potential to follow Russia’s lead in diversifying its foreign exchange reserves.
Like Russia, China faces increasing geopolitical tensions with the United States and its allies. Trade disputes, technological competition, and disagreements on various international issues have strained Sino-American relations.
China’s Timeline of Dumping Actions
In 2018, China held the largest share of US Treasuries, with a notable 17.3% of the total, amounting to approximately US$1.113 trillion. This position surpassed Japan, the second-largest holder, with holdings valued at $1.064 trillion, accounting for 16.4% of all US Treasuries. However, in recent years, some noteworthy developments have taken place. China has been gradually reducing its holdings of US Treasuries, as reported by the US Treasury Department. This reduction, combined with the expansion of its gold reserves, indicates a degree of diversification.
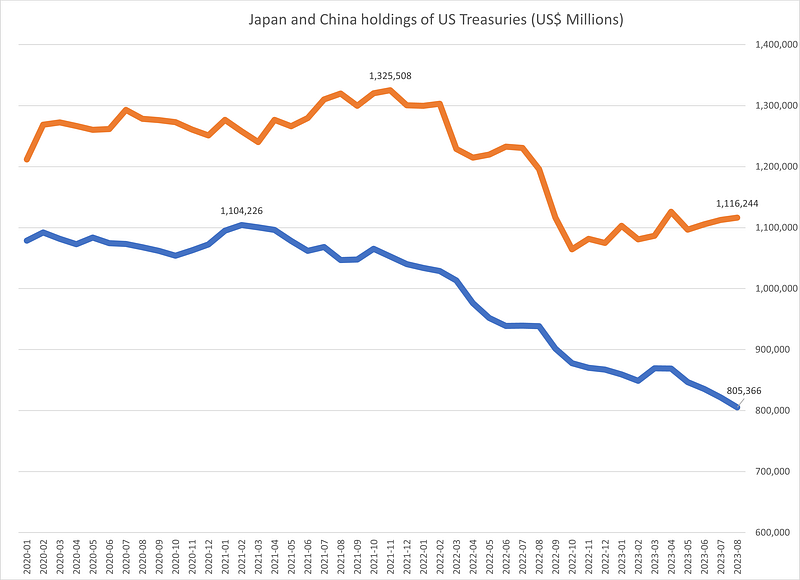
In Figure 6, a comparison of China and Japan’s holdings of US Treasuries is presented for the period spanning January 2020 to August 2023. The data illustrates a rapid decline in China’s holdings, moving from a peak of $1.104 trillion in early 2021 to $0.805 trillion in August 2023. This reduction amounts to a significant 27% decrease or a substantial $0.3 trillion cut. Japan has now emerged as the top holder, amassing a balance of $1.116 trillion in US Treasuries as of August 2023.
China’s Timeline of Hoarding Actions
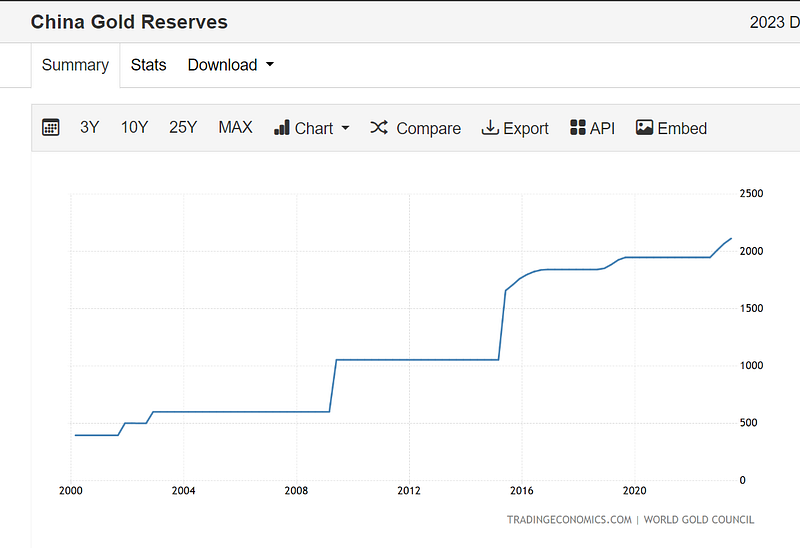
Gradual Gold Accumulation (2000–2023): The China central bank’s gold holdings increased by several jumps during this period from less than 500 tons to more than 2000 tons, a more than 300% increase (Figure 7). By June 2022, China’s gold reserves reached approximately 2,113 tons, making it the sixth largest holder of gold, immediately after Russia (Figure 5).
Conclusion
Russia’s decision to sell US Treasuries and increase its gold reserves is a strategic move designed to protect its economy from the potential repercussions of Western sanctions. This shift reflects Russia’s desire to reduce its dependence on the US dollar, enhance economic stability, and demonstrate resilience in the face of geopolitical challenges. The extent to which this strategy insulates Russia from sanctions remains to be seen, but it is a significant step in the Kremlin’s efforts to prepare for the aggression.
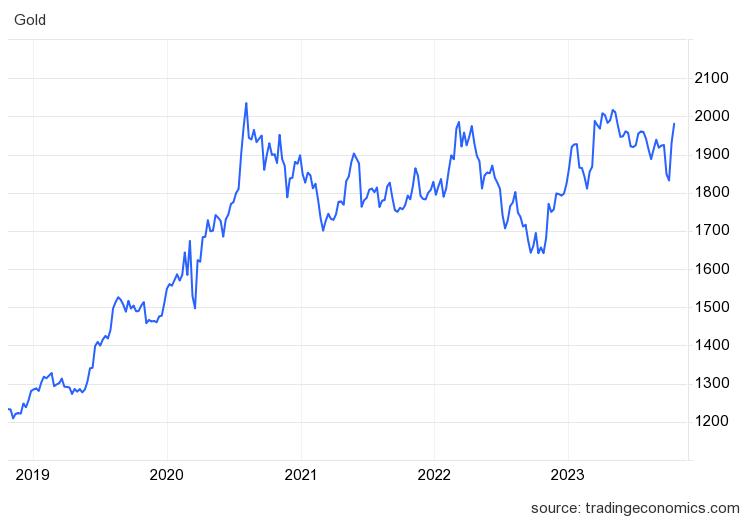
In the past decade, gold prices have seen a notable increase due to various factors, including countries’ actions to hoard the precious metal. Figure 8 illustrates this trend, showing that gold prices began to rise in 2019, climbing from approximately US$1,200 per ounce to a recent peak of US$2,037 in August 2020. Events like the Russia-Ukraine conflict led to gold prices reaching US$1,976 in early 2022 and approximately US$2,022 in May 2023. Similarly, the outbreak of the Hamas-Israeli conflict pushed gold prices up to US$1,972 again on 16 October 2023 (Figure 8). It is a common trend that gold prices tend to rise during periods of international conflicts and wars. This represents a strategic move to bolster gold reserves in anticipation of potential aggressions.
References
Doff, N. (2018) Russia Dumps Treasuries for Gold. Bloomberg, June 21. https://www.bloomberg.com/news/articles/2018-06-20/russia-dumps-treasuries-for-gold-in-pivot-after-sanctions-scare#xj4y7vzkg
Richter, W. (2018) Russia Dumped Most of its US Treasury Holdings, Disappeared from List. Wolf Street, July 17. https://wolfstreet.com/2018/07/17/russia-dumped-most-all-its-us-treasury-holdings-disappeared-from-list/
Yiu, C.Y. (2022) [Financial War] Sanctions on Russia: An Experiment on Fiat Money, Medium, Mar 3. https://readmedium.com/financial-war-sanctions-on-russia-an-experiment-on-fiat-money-da93e247ed59


