
Running Spring Boot Apps? Start Tracing with OpenTelemetry in Minutes!
This blog post applies to Spring Boot 2 only. Please read the updated version — Distributed Tracing with Spring Boot 3 Micrometer vs OpenTelemetry.
Seriously. Enabling Distributed Tracing in Spring Boot applications is as easy as adding a few dependencies. But that has been the case for quite some time. So what’s new to discuss?
OpenTelemetry.
OpenTelemetry (or OTEL for short) has managed to evolve into an open standard that is being adopted by all the major players in this ecosystem. This allows you to trace a request through a bunch of polyglot services without being bound to a vendor’s implementation.
If you are writing a Spring Boot application (or any other framework for that matter), you should consider using OpenTelemetry for tracing.
OTEL libraries are available for various languages with different level of maturity. You can find more information about it at the OTEL documentation.
In this blog, I will show you how to enable tracing in Spring Boot and demonstrate the power of the open standard.
Spring Cloud Sleuth + OpenTelemetry
OpenTelemetry provides an agent (JAR) to attach with Java applications for generating traces. But who really wants to deal with agents? Thanks to Spring Cloud Sleuth abstraction which delegates the instrumentation to OpenTelemetry and allows us to get up and running quickly.
Here’s how you enable it on an existing Spring Boot application:
See the first comment on the Gist for an explanation of the dependencies.
This is enough for the spans to be generated. What actually gets generated depends on the Spring features in use. Rest Controllers? ✅. RestTemplate/WebClient? ✅. Spring Data JPA/JDBC? ✅. Apache Kafka? ✅. Check out the full list of Sleuth Integrations. Note quite a lot of these are part of the upcoming Spring Boot 2.6 release.
Let’s run through an example to see it all in action.
Example 1: Services communicating via HTTP calls
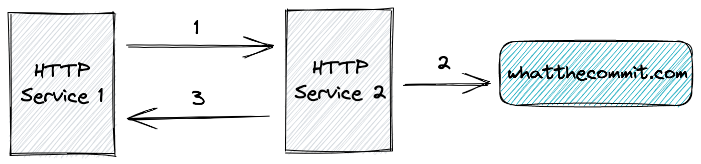
- HTTP Service 1 makes a
GETcall to HTTP Service 2. - HTTP Service 2 makes a
GETcall to whatthecommit.com. - HTTP Service 2 returns the response from whatthecommit.com back to HTTP Service 1.
Source code available at https://github.com/xsreality/spring-boot-tracing-demo.
Running the application creates Trace and Span IDs that are included in the log lines via Logback MDC. These would look like below:
2021-11-06 00:10:02.278 INFO [http-service2,8a45749d445c4e5c4846c931d7f488c5,36a8075ff900ddd4] 9068 --- [nio-8081-exec-1] com.example.HomeController : Another bug bites the dustIf your application uses custom log pattern and you don’t see the trace IDs in the logs, switch to the default pattern used by Spring or at least use the LOG_LEVEL_PATTERN variable:
<property name="CONSOLE_LOG_PATTERN"
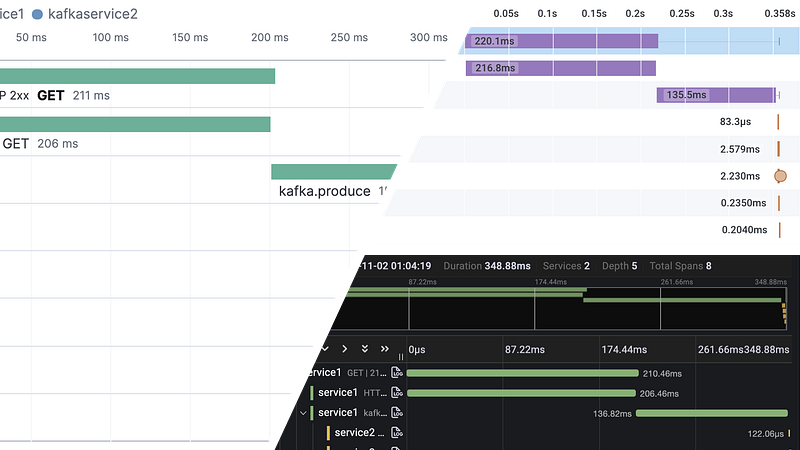
value="%clr(%d{yyyy-MM-dd HH:mm:ss.SSS}){faint} %clr(${LOG_LEVEL_PATTERN:-%5p}) %clr(${PID:- }){magenta} %clr(---){faint} %clr([%15.15t]){faint} %clr(%-40.40logger{39}){cyan} %clr(:){faint} %m%n${LOG_EXCEPTION_CONVERSION_WORD:-%wEx}"/>The Trace and Span ID generation confirms that tracing with OTEL is working. Here’s how it would look when visualized by a tool that understands the OTEL spans.
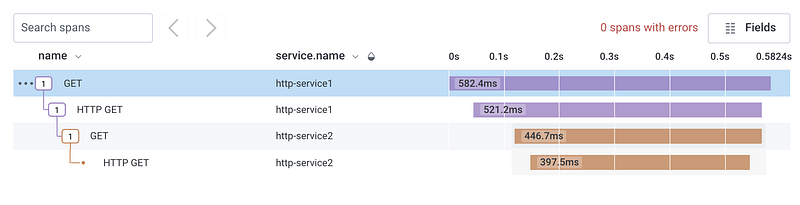
Don’t worry, we will see how to export the spans in a minute.
Example 2: Services communicating via Apache Kafka
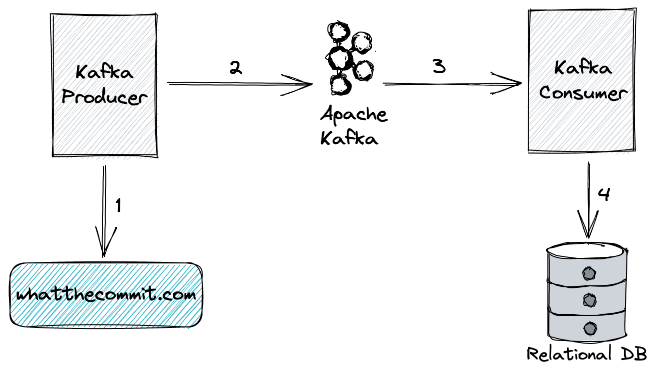
- Kafka Producer makes a
GETcall to whatthecommit.com. - Kafka Producer produces the response from Step 1 to Apache Kafka.
- Kafka Consumer consumes the message from Apache Kafka.
- After consumption, Kafka Consumer store the record in H2 in-memory DB.
NOTE: Capturing traces over Apache Kafka and JDBC query requires Spring Boot 2.6 and Spring Cloud 2021.0 which is not yet released as of 8th Nov 2021. But the release is right around the corner and I am excited to share the new capabilities!
JDBC Query tracing requires including an additional library to proxy the JDBC Data source. You have two options — p6spy and datasource-proxy. I had some weird issues with the latter when using it in a JDBC heavy application. P6Spy worked flawlessly for me. But I don’t know enough to recommend one over another. Check the pom.xml for exact dependency to include.
Exporting Spans to an Instrumentation Backend
Un-exported spans are like unopened box of candies. They need to be consumed by an instrumentation backend to be fully enjoyed. This is where the open standard of OTEL shines. Any system that supports the OTEL protocol (OTLP) can be used for exporting the traces. More and more systems are adding support for OTEL, so we have choices! Here I will show you 3 tools — Honeycomb, Grafana Tempo and Elastic APM. Let’s export the traces of the second example to Honeycomb and check the visualization.
Exporting the spans is easy. Just add below properties in application.yaml
spring.sleuth.otel.exporter.otlp.endpoint: https://api.honeycomb.io
spring.sleuth.otel.exporter.otlp.headers.x-honeycomb-team: xxx
spring.sleuth.otel.exporter.otlp.headers.x-honeycomb-dataset: dataset
You will have to signup for an account in Honeycomb (it’s free!) and create the dataset and API key.
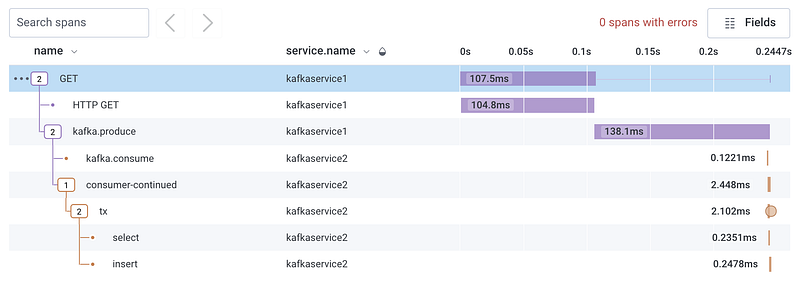
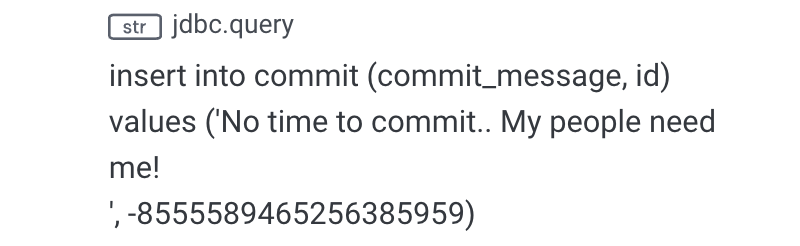
Click on any span to see the attributes. The insert span for example has the the jdbc.queryattribute which captures the exact query.
Let’s see how the spans look in Grafana Tempo. You can sign up on Grafana Cloud to get the configuration values. Set the following properties:
spring.sleuth.otel.exporter.otlp.endpoint=https://tempo-eu-west-0.grafana.net
spring.sleuth.otel.exporter.otlp.headers.authorization=Basic MTA5...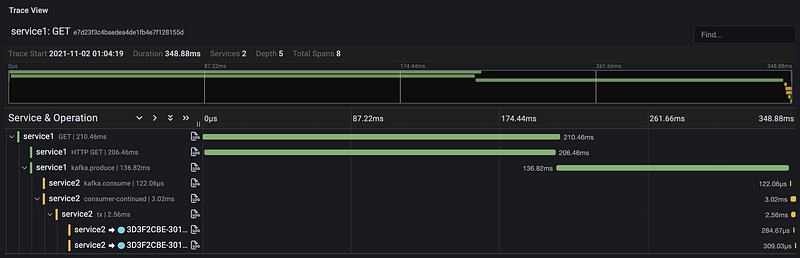
If you have the Elastic stack already in place for logs, then you can export the traces as well.
spring.sleuth.otel.exporter.otlp.endpoint=https://xxx.azure.elastic-cloud.com
spring.sleuth.otel.exporter.otlp.headers.authorization=Bearer XXX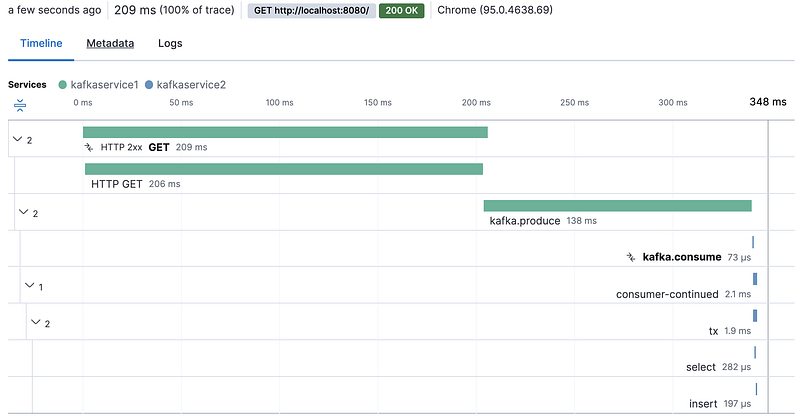
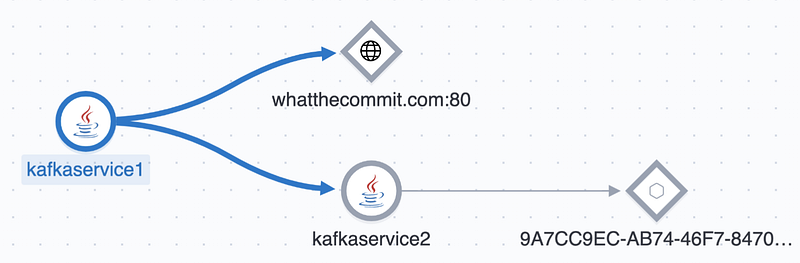
Elastic APM shows the dependencies between the services on the Service Map page. The service with random name is the database, not sure why it does not recognize it as such.
And that’s how you can use OpenTelemetry to avoid vendor lock-in!
Personally, I like the interpretation of Honeycomb as it allows querying and aggregating the span attributes as you wish. I am curious to try it out with real production spans.
Good to Know
Trace ID Ratio Based Sampling
One thing that stumped me when I was researching this topic was that not all traces were being exported to the instrumentation backend. It was only after executing the service a few times that I would get a single trace exported. It was quite annoying until I stumbled upon an important configuration related to sampling.
When using Spring Cloud Sleuth OTel, by default only 1 in 10 traces are exported! This is because the Trace ID Ratio based sampling is in use with the default value of the config spring.sleuth.otel.config.trace-id-ratio-based is set to 0.1! While this is appropriate for production with heavy traffic to avoid overloading the tracing system and affecting performance of the application, when testing you do want to see each and every trace exported. So, just set the configuration to 1.0 now and thank me later! Read more about it here and here.
Stable release of OTEL Java Instrumentation Library
The OTEL Java library is not marked Stable. You can track the progress of remaining items at below link. As of writing this, 96 of 99 tasks are already completed, so we are very close!
Tracing JDBC Queries without Parameter Values
When using p6spy to trace JDBC queries, by default the query will include the parameter values. In most cases, this may not be a good idea as the data might be sensitive and you don’t want that anywhere outside your DB. By setting the configuration spring.sleuth.jdbc.p6spy.tracing.include-parameter-values to false, you can replace the parameter values with ?.
So instead of capturing insert into commit (commit_message, id) values (‘The universe is possible ‘, 4497884046194566862) you will capture insert into commit (commit_message, id) values (?, ?).
Limiting the JDBC Tracing Scope
Spring Sleuth JDBC captures three types of traces — query, fetch and connection. The query trace is interesting and should always be captured, but I did not findfetch and connection traces that interesting. You can choose what trace to capture with the configuration spring.sleuth.jdbc.includes. So to only capture JDBC queries, set the configuration to query.
Extending the Trace in Kafka Consumer
Currently, there is a limitation in the Kafka consumer tracing where the span is closed automatically which means tracing the processing of message will result in a new Trace ID instead of continuing the existing trace. You can find more details about it and the fix at below link. Here’s a working example.
Conclusion
As you can see, Spring Cloud Sleuth and OpenTelemetry are a powerful combination that can take your existing Spring Boot application and give you insights that goes beyond logs and metrics. If you have not yet explored distributed tracing, now is the time to do so. Your standby pool will thank you!
Resources
- All examples shown here are available at https://github.com/xsreality/spring-boot-tracing-demo
- Spring Cloud Sleuth OTel Documentation
- Track OTEL Java Instrumentation work at https://github.com/open-telemetry/opentelemetry-java-instrumentation/issues/2713
- Supported integrations of Spring Cloud Sleuth in upcoming Spring Cloud 2021.0.*


