Running Kafka in KRaft Mode
No more Zookeeper.
Introduction
In this article we will see how to run Kafka without Zookeeper, which soon will be the only way to run Kafka. In the article we will first look at some history and definitions. Then setup a three broker cluster in KRaft mode followed by testing our cluster. Finally we will take a deep dive into some of the internals of how the metadata is stored within the cluster now that Zookeeper is no longer in the picture.
Background
Since at some point in 2021 or early 2022 Kafka has had the ability to run without Zookeeper in early release mode and rely solely on what we will see is something called KRaft. Soon this will be the sole mode of operation for Kafka. In this article we will setup a 3 node Kafka cluster in this mode and run some tests to verify that all is working correctly.
In early 2024 the final Kafka release with zookeeper will be made and then as of April 2024 Kafka will be release solely supporting KRaft for metadata management and zookeeper will be deprecated.
How will Kafka work without Zookeeper? It is hard to believe, as Kafka has always been intertwined with Zookeeper and reliant on it for operating. In its current form in Kafka, Zookeeper acts as a external metadata management system. Zookeeper’s cluster, called an ensemble, acts as the control center for Kafka storing information on offsets, consumer, consumer group and topic metadata. We all know from using Kafka the additional overhead and complexity added from managing the Zookeeper part of the deployment. There is also a factor of performance with it being an external component.
Since the modification to not require Zookeeper, it can be run using Kafka Raft metadata mode or KRaft mode. There will be a KRaft Quorum of controller nodes which will be used to store the metadata. The metadata will be stored in an internal Kafka topic called @metadata. The Kafka cluster meta-data is now only stored in the Kafka cluster itself, making metadata update operations faster, scalable and less complex to manage.
What is KRaft
Raft is a consensus protocol. Kafka uses that Raft consensus protocol to manage its own metadata. KRaft simplifies Kafka’s architecture by removing the need for a separate coordination service, Zookeeper. Brokers are deemed controllers and brokers and In KRaft mode, only the controller quorum (a subset of brokers) participates in the Raft protocol, while the rest of the brokers only communicate with the controller quorum. In KRaft mode, cluster metadata, reflecting the current state of all controller managed resources, is stored in a single partition Kafka topic called __cluster_metadata. KRaft uses this topic to synchronize cluster state changes across controller and broker nodes. Below we see a depiction of how a cluster looks running in KRaft Mode. Note the Zookeeper Ensemble is no longer part of the active deployment.
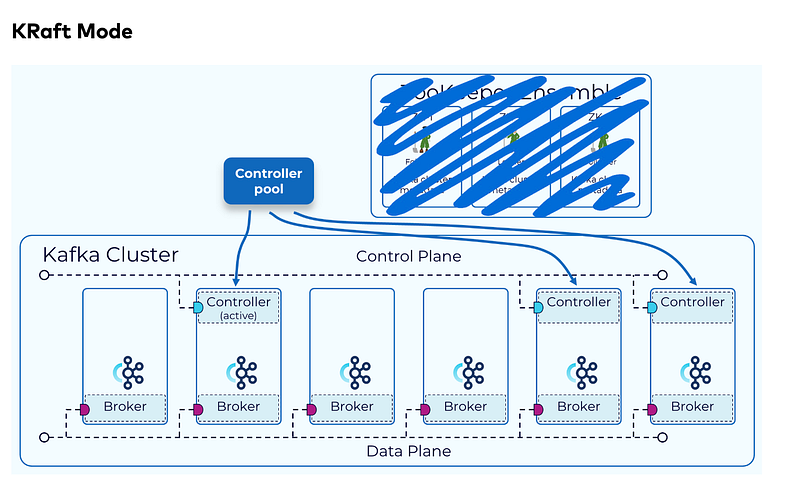
Brokers can be controllers only, brokers only, or designated controller, brokers both.
Let’s look at how we can setup a cluster in KRaft mode.
Setup
First we need to download a version of Kafka, I have downloaded version 3.6.1 from https://kafka.apache.org/downloads.
This was the Scala 13 version, there is also a Scala 12 version available.
I copied the downloaded compressed file into a directory on my machine under home in a directory called kafka and uncompressed it using the following command.
tar -xvzf kafka_2.13-3.6.1.tgzWhich created a directory called kafka_2.13–3.6.1 and then cd’d into it.
Decompressing the files created a directory tree as follows.
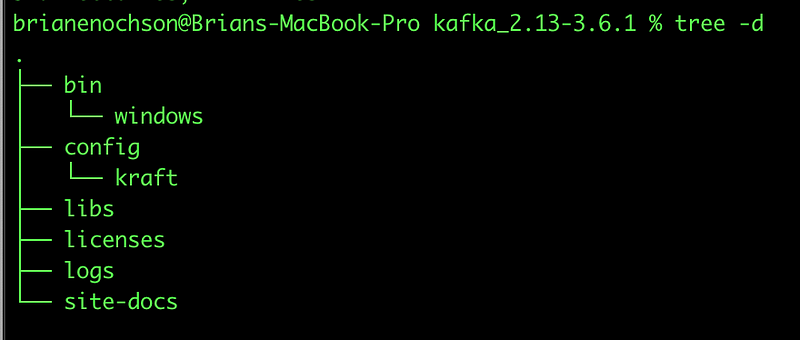
We are specifically interested in the bin and in the config/kraft directories as we proceed with the installation.
We will start out by going into the config/kraft directory and running the following command. We want to create a three broker cluster so we will create three server property files.
cp server.properties server1.properties && cp server.properties server2.properties && cp server.properties server3.propertiesWe will need to modify each one, starting with server1.properties.
This should be modified to have the following properties, only showing the items that might need to be edited.
server1.properties
node.id=1

controller.quorum.voters=1@localhost:19092,2@localhost:19093,3@localhost:19094

listeners=PLAINTEXT://:9092,CONTROLLER://:19092

advertised.listeners=PLAINTEXT://localhost:9092

log.dirs=/tmp/server1/kraft-combined-logs
server2.properties
node.id=2

controller.quorum.voters=1@localhost:19092,2@localhost:19093,3@localhost:19094

listeners=PLAINTEXT://:9093,CONTROLLER://:19093

advertised.listeners=PLAINTEXT://localhost:9093

log.dirs=/tmp/server2/kraft-combined-logs
server3.properties
node.id=3

controller.quorum.voters=1@localhost:19092,2@localhost:19093,3@localhost:19094

listeners=PLAINTEXT://:9094,CONTROLLER://:19094

advertised.listeners=PLAINTEXT://localhost:9094

log.dirs=/tmp/server3/kraft-combined-logs
Once these three files are done we need to move on and generate our cluster id. This is a unique id that will be used to identify our cluster across brokers.
./bin/kafka-storage.sh random-uuid
This will generate an ID as shown below in the screenshot. Copy this value and save it, as this will be used in the next steps.

We then need to format all the storage directories. This is basically the directory that we put in logs.dir property in the respective server property file.
This can be done with the following commands.
./bin/kafka-storage.sh format -t 5BJG0Wh-TaO03HmEi0pXvg -c ./config/kraft/server1.properties

./bin/kafka-storage.sh format -t 5BJG0Wh-TaO03HmEi0pXvg -c ./config/kraft/server2.properties

./bin/kafka-storage.sh format -t 5BJG0Wh-TaO03HmEi0pXvg -c ./config/kraft/server3.properties
This is the last of the setup steps and now we are ready to start our brokers.
If you have any issues in your server properties, such as a typo, they will be reported during the storage formatting of the directories. You can simply fix these and rerun the command.
Startup
We will start the nodes one at a time. I opened three different terminal tabs and in each one I ran the following three commands, one per tab.
./bin/kafka-server-start.sh ./config/kraft/server1.properties
For the first broker. And in the next tab.
./bin/kafka-server-start.sh ./config/kraft/server2.properties
For the second broker.
./bin/kafka-server-start.sh ./config/kraft/server3.properties
Was run for the third broker. Below shows the output of a broker starting.
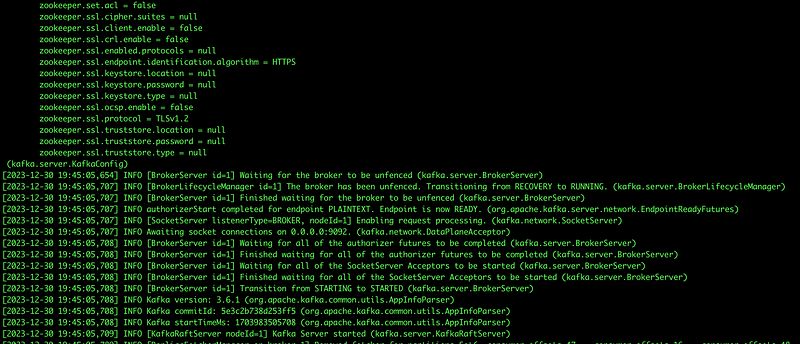
Once this is done and there are no errors in any of the tabs you have a running cluster. Now let’s confirm for sure all is running.
Testing
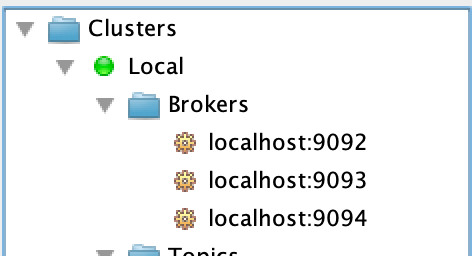
When each started I was able to verify all were running. For this I used a tool Offset Explorer, but can also use one of many others if you like, for instance Kadeck.
Let’s create a topic now that we will use in our testing.
bin/kafka-topics.sh --create --topic brianeno-test --partitions 3 --replication-factor 3 --bootstrap-server localhost:9092This creates a topic named brianeno-test with 3 partitions and replication factor of 3. Next verify it was created.
bin/kafka-topics.sh --bootstrap-server localhost:9093 --list
We can also describe the topic we just created.
bin/kafka-topics.sh --bootstrap-server localhost:9093 --describe --topic brianeno-test
Which results in the following, confirming the partition and replication settings we taken correctly.
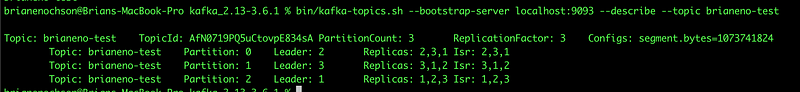
The cluster is looking good!
Let’s send some messages on our new topic new. To do this we will use two console windows. One window where we will open a producer and one where we will have a consumer.
In one we will run the following.
bin/kafka-console-consumer.sh --bootstrap-server localhost:9092 --topic brianeno-test
This will start a consumer. In the second the following can be run.
bin/kafka-console-producer.sh --broker-list localhost:9092 --topic brianeno-test
Where you can type in any text and after hitting enter should see it in appear in the first window.
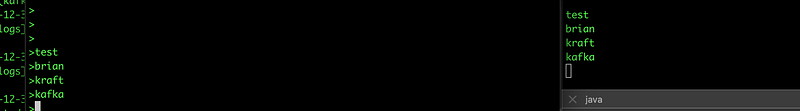
The cluster seems to be working correctly and our topic is receiving and allowing messages to be consumed without issue.
Internals
If you are familiar with the format of the metadata (or not even) in Zookeeper you can explore the same within Kafka using the metadata-shell tool. This can be run against the metadata on one of the brokers as follows.
bin/kafka-metadata-shell.sh --snapshot /tmp/server1/kraft-combined-logs/__cluster_metadata-0/00000000000000000000.logThis will bring you to the shell, which is basically a command line tool allowing you to browse the directory structure where the metadata is stored.

I can cd to image and then check my brokers via cluster. This is shown below.
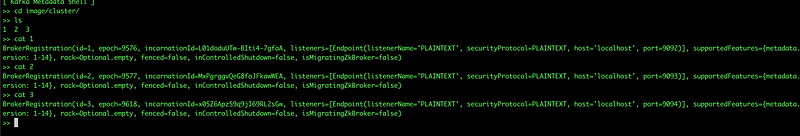
The commands are as follows for those copying them out.
>> cd image/cluster/
>> ls
1  2  3
>> cat 1
BrokerRegistration(id=1, epoch=9576, incarnationId=L01doduUTw-BIti4-7gfaA, listeners=[Endpoint(listenerName='PLAINTEXT', securityProtocol=PLAINTEXT, host='localhost', port=9092)], supportedFeatures={metadata.version: 1-14}, rack=Optional.empty, fenced=false, inControlledShutdown=false, isMigratingZkBroker=false)
>> cat 2
BrokerRegistration(id=2, epoch=9577, incarnationId=MxPgrggvQeG8foJFkawWEA, listeners=[Endpoint(listenerName='PLAINTEXT', securityProtocol=PLAINTEXT, host='localhost', port=9093)], supportedFeatures={metadata.version: 1-14}, rack=Optional.empty, fenced=false, inControlledShutdown=false, isMigratingZkBroker=false)
>> cat 3
BrokerRegistration(id=3, epoch=9618, incarnationId=x05Z6ApzS9q9jI69RL2sGw, listeners=[Endpoint(listenerName='PLAINTEXT', securityProtocol=PLAINTEXT, host='localhost', port=9094)], supportedFeatures={metadata.version: 1-14}, rack=Optional.empty, fenced=false, inControlledShutdown=false, isMigratingZkBroker=false)
>>
You can also view topic information within the metadata shell tool.
>> cd ..
>> cd topics/
>> ls
byId  byName
>> cd byName/
>> ls
__consumer_offsets  brianeno-test
>> cd brianeno-test/
>> ls
0  1  2  id  name
>> cat 0
PartitionRegistration(replicas=[2, 3, 1], isr=[1, 2, 3], removingReplicas=[], addingReplicas=[], leader=1, leaderRecoveryState=RECOVERED, leaderEpoch=9, partitionEpoch=19)
>> cat 1
PartitionRegistration(replicas=[3, 1, 2], isr=[1, 2, 3], removingReplicas=[], addingReplicas=[], leader=1, leaderRecoveryState=RECOVERED, leaderEpoch=10, partitionEpoch=19)
>>
We are going to run the kafka-dump-log command to decode cluster metadata. The output contains different event types such as topic creation and topic’s partition creation. In case of quorum issues, you can dump the log file and search the cluster status changes for each node.
This is done with the following command.
bin/kafka-dump-log.sh --cluster-metadata-decoder --files /tmp/server1/kraft-combined-logs/__cluster_metadata-0/00000000000000000000.log --print-data-log | moreWhich displays the following (only a portion is shown of a much longer display).
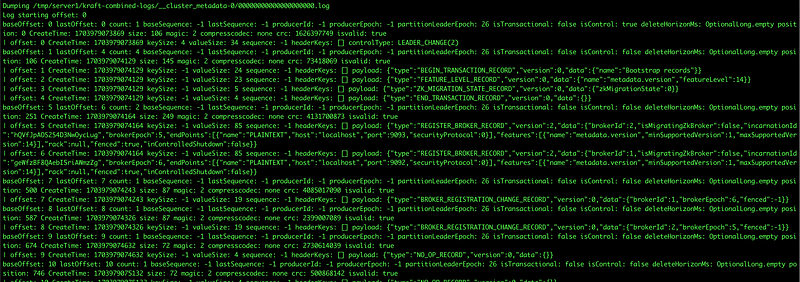
This is valuable information when needing internal information and as you see, just as before with Zookeeper all metadata information is available.
Another tool is metadata-quorum.sh. This can be run with the following command.
bin/kafka-metadata-quorum.sh --bootstrap-server localhost:9092 describe --status
and provides the following output.
ClusterId:              yJ2lFzpcRwW7qi274wUBmA
LeaderId:               2
LeaderEpoch:            48
HighWatermark:          12184
MaxFollowerLag:         0
MaxFollowerLagTimeMs:   445
CurrentVoters:          [1,2,3]
CurrentObservers:       []
More internal information which would be useful to anyone managing a cluster. Another variant is this.
bin/kafka-metadata-quorum.sh --bootstrap-server localhost:9092 describe --replication
Displaying information as follows.
NodeId LogEndOffset Lag LastFetchTimestamp LastCaughtUpTimestamp Status
2      13024        0   1704018032814      1704018032814         Leader
1      13024        0   1704018032455      1704018032455         Follower
3      13024        0   1704018032459      1704018032459         Follower
Stopping one of the brokers (broker 3) and rerunning the same command shows a lag.
NodeId LogEndOffset Lag  LastFetchTimestamp LastCaughtUpTimestamp Status
2      13286        0    1704018153880      1704018153880         Leader
1      13286        0    1704018153683      1704018153683         Follower
3      13262        138  1704018142103      1704018141651         Follower
In the right circumstance would definitely be useful.
With that we have completed our view into some of the internal information.
Summary
In this article we saw how to setup a Kafka cluster with three brokers in KRaft mode. Server configuration was explained, initial setup as well as testing of the cluster by creating a topic and producing and consuming messages onto the cluster. The last portion of the article we spent looking at some of the tools used for inspecting the internals of the metadata management within Kafka which provides insight into the operating cluster.
Enjoy the journey.
🔔 If you enjoyed this, subscribe to my future articles, follow me if you like or view already published articles here. 🚀
➕Join the Medium Membership Program to support my work and connect with other writers.
📝 Have questions or suggestions or any ideas for topics? Leave a comment or message me through Medium.
Thank you for your support! 🌟


