
Rightsizing Kubernetes requests/Limits usage
At the end of last year, I started seeing this error pop up on occasion when I deploy a new deployment into my cluster — So thought this was a good opportunity to do some house keeping.
Events:
  Type     Reason            Age                   From               Message
  ----     ------            ----                  ----               -------
  Warning  FailedScheduling  4m33s                 default-scheduler  0/3 nodes are available: 3 Insufficient cpu. preemption: 0/3 nodes are available: 3 No preemption victims found for incoming pod..
  Warning  FailedScheduling  3m52s (x2 over 4m9s)  default-scheduler  0/3 nodes are available: 3 Insufficient cpu. preemption: 0/3 nodes are available: 3 No preemption victims found for incoming pod..
It was also good timing with Datadog releasing their container report, which had some interesting facts about resource utilisation across container deployments.
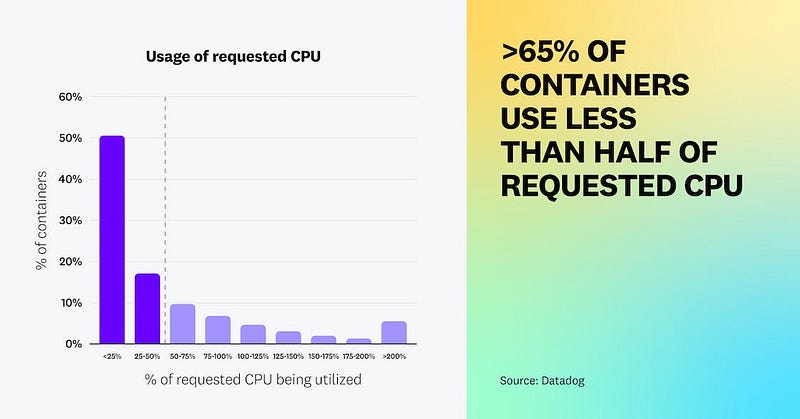
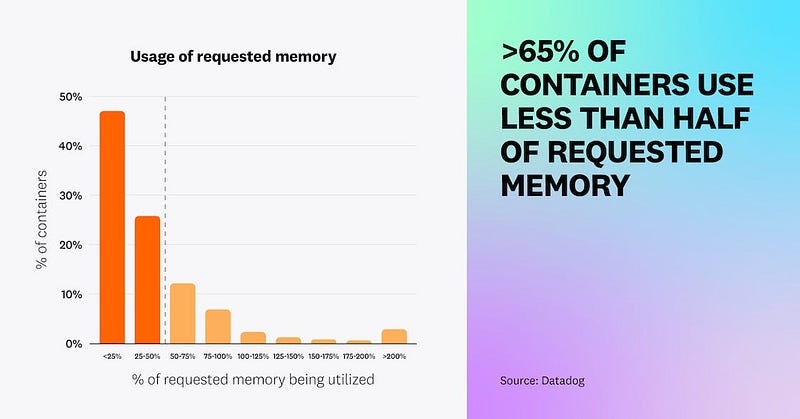
The full report is an interesting read, I’ve included the link below:

Investigation
I can see using kubectl top nodes that my resource usage across my cluster isn’t that high which is good and confirms the issue is only related to the requests/limits that I’ve set on my deployments and not any capacity issues with my cluster.
kubectl top nodes
NAME          CPU(cores)   CPU%   MEMORY(bytes)   MEMORY%
hk8s-master   813m         20%    11055Mi         70%
hk8s-node1    633m         15%    7221Mi          45%
hk8s-node2    640m         16%    8323Mi          52%
I’ve been pretty heavy handed with the values I’ve been setting on my resources I’ve been deploying onto my Kubernetes clusters (frequently setting high requests and limits values), definitely over provisioning what various tooling requires.
I found this super handy tool kube-capacity which allows you to see how you have provisioned the limits/requests for your pods on the cluster centrally.
kube-capacity
NODE          CPU REQUESTS   CPU LIMITS          MEMORY REQUESTS   MEMORY LIMITS
*             11350m (94%)   1674350m (13952%)   10037Mi (21%)     21474Mi (45%)
hk8s-node2    3760m (94%)    608150m (15203%)    3394Mi (21%)      7907Mi (50%)
hk8s-master   3910m (97%)    760600m (19015%)    2399Mi (15%)      7439Mi (47%)
hk8s-node1    3680m (92%)    305600m (7640%)     4245Mi (26%)      6129Mi (38%)
So the bad news here is that it looks like something has gone drastically wrong with the cpu provisioning!
The good news is that (as we confirmed earlier) we have enough resources and I’m now aware of this issue and can start rightsizing.
But what does it mean?
When you deploy pods into Kubernetes, you have the ability to set both Requests and Limits for both CPU and Memory.
The Kubernetes docs provide a lot of detail about this functionality within Kubernetes (docs) but a simple way of looking at it is:
- Requests: This is the number of resources that are requested by the deployed pod so that the scheduler can determine which node has the available capacity to run the pod. Kubelet reserves these resources for the pod.
- Limits: Kubelet uses these limits to restrict the resources that are allowed to be used by a pod. If more resources are used than the limit, the pod will be terminated (or throttled in the case of CPU).
Units of measurement
For CPU, the unit of measurement m denotes millicores (as a % of 1 core).
So if you set the value 1 this will be one full core, 100m is the equivalent of 0.1 — Both of which are valid values.
For memory, these are various units of measurements that can be used, as described here in the docs.
Limits and requests for
memoryare measured in bytes. You can express memory as a plain integer or as a fixed-point number using one of these quantity suffixes: E, P, T, G, M, k. You can also use the power-of-two equivalents: Ei, Pi, Ti, Gi, Mi, Ki. For example, the following represent roughly the same value:
128974848, 129e6, 129M, 128974848000m, 123MiTo keep things simple and standard in my manifest files, I try to keep the unit the same across all of my deployments and standardise using Mi to denote the memory limits and requests.
Example:
          resources:
            limits:
              cpu: 200m
              memory: 512Mi
            requests:
              cpu: 100m
              memory: 256Mi
You can see from the manifest above that is for my pihole instance, that it is requesting 100m of CPU, with a limit of 200m as well as 256Mi of memory, with a limit of 512Mi.
When the pod is deployed onto a node, Kubelet will reserve 256Mi of memory and 100m of CPU. If the pod requests greater than 512Mi of memory, the pod will be terminated or more than 200m of CPU and the pod will experience throttling.
So with that in mind, we can see how over provisioning the requests for either CPU or Memory can cause Kubernetes to refuse to schedule pods to nodes which are over provisioned as there will not be sufficient resources to meet the request.
How to start rightsizing
So it’s clear from the above that something has gone very wrong for the limit percentages of the cluster to be so skewed. This won’t be causing my issue with the CPU scheduler but given the amount it’s skewed by it’s definitely worth taking a look.
Running the following command will use kube-capacity to show the limits/requests configured per pod, as well as the current utilisation by that pod.
kube-capacity --pods --utilAs I only have ~200 pods in the cluster this won’t be a huge task to go through and prioritise rightsizing the pods.
However, after running the command I spotted a few outliers which explain the huge %s in the first output.
observability git:(replace_api_key) kube-capacity --pods --util | grep "db-"
hk8s-node2    keephq                  db-5958c4689b-l8qtd                                      100m (2%)      150000m (3750%)     4m (0%)       20Mi (0%)         48Mi (0%)       41Mi (0%)
hk8s-master   ha                      db-79cb54c96f-j6vgk                                      100m (2%)      150000m (3750%)     1m (0%)       20Mi (0%)         48Mi (0%)       39Mi (0%)
hk8s-node1    backstage               db-6b5855448-4g92p                                       100m (2%)      150000m (3750%)     0m (0%)       20Mi (0%)         48Mi (0%)       0Mi (0%)
It looks as though every postgres instance I have deployed has a massively over provisioned limit.. Opened up the helm chart which I use to deploy Postgres and spot this:
        limits:
          cpu: 150
          memory: 50M
The missing m after CPU has caused each Postgres pod to have a limit of 150000m!
I updated the helm charts for Postgres and this % dropped massively across the whole cluster.
Going back to the main task at hand, I started by looking at the pods which had the highest numbers of CPU requests (as this is where we are bound currently). Reducing these first should have the most “bang for our buck” in terms of rightsizing the cluster.
You can filter by namespace/deployment using a handy grep (to include the column titles) eg:
kube-capacity --pods --util | grep "pihole\|NAME"
NODE          NAMESPACE               POD                                                      CPU REQUESTS   CPU LIMITS    CPU UTIL      MEMORY REQUESTS   MEMORY LIMITS   MEMORY UTIL
hk8s-master   pihole                  pihole-74f5b8f5b7-z9cgg                                  100m (2%)      200m (5%)     5m (0%)       256Mi (1%)        512Mi (3%)      44Mi (0%)
So I went through the process of going through each deployment that I have on my cluster and rightsizing the CPU and memory requests / limits that I had set to something more reasonable.
The metrics provided by kube-state-metrics and Prometheus was really useful here to see trends of CPU and Memory usage over time to tune these values a bit better with some context of actual usage.
Thanks to a comment from Didier H — It is worth considering resources used throughout the whole lifecycle of a pod (including startup) as some apps will require more resources when starting up, so setting limits based on runtime usage could impact startup time.
Wrap up
My cluster is now looking a lot healthier in terms of the requests and limits after the tidy up task (I also added another node since starting to write this article).
Will definitely be a lot more conscious when setting requests and limits in my future deployments!
➜  ~ kube-capacity
NODE          CPU REQUESTS   CPU LIMITS     MEMORY REQUESTS   MEMORY LIMITS
*             6750m (42%)    9100m (56%)    9220Mi (14%)      16694Mi (26%)
hk8s-master   1755m (43%)    1600m (40%)    1339Mi (8%)       3742Mi (23%)
hk8s-node1    1665m (41%)    4150m (103%)   2719Mi (17%)      6245Mi (39%)
hk8s-node2    1775m (44%)    2100m (52%)    2334Mi (14%)      4966Mi (31%)
hk8s-node3    1555m (38%)    1250m (31%)    2830Mi (17%)      1742Mi (11%)
Next step here for me will be to use Prometheus to set up some observability around the % of requested resources vs available and alert if this is reaching capacity across my nodes.
Hope you have found this an interesting read, please follow for more of the same! 🙇


