
Real-time Model Interpretability API using SHAP, Streamlit and Docker
A self-service API to explain model scores real-time

Background
As a data scientist, you take a business problem and formulate it into a data science problem. Next, you build a solution/model to address the problem. You validate the model with test and out of time data to ensure it is not biased. Finally, you deploy the model in production, monitor the performance of model, conduct experimentations and so on. In addition to these tasks, you present your findings to business stakeholders and sometimes work with them to educate and effectively use your model. Is your job done? Not yet.
The end users of your model might ponder and come up with questions like this— “Why did your model predict this customer as so and so?” or “Could you explain why we get this output from your model?”. Even though you have a proper documentation (assuming you did it), it cannot explain your model predictions on a case by case basis. Consider a scenario where you built a model to classify cats/dogs. Your documentation looks like this.
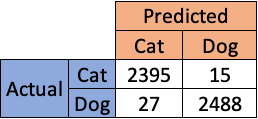
When an end user asks you “Why did your model predict this image as a cat?”

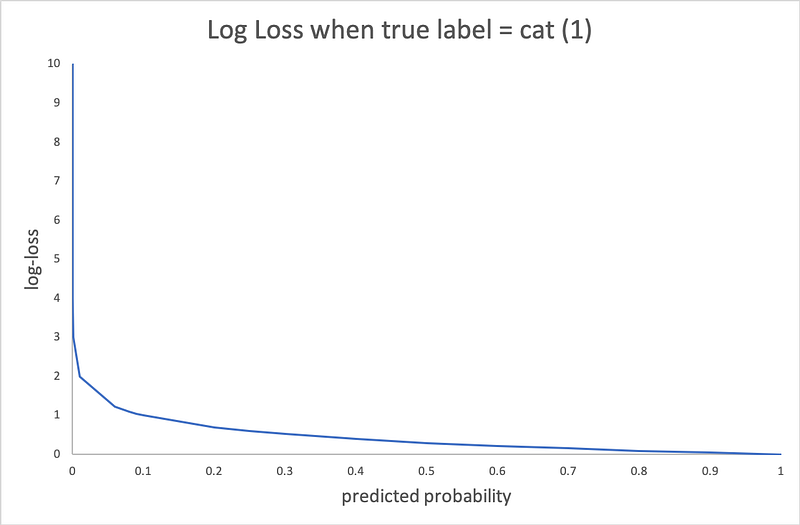
The documentation provided above cannot answer these type of questions. When you have a linear model, you can use the parameter estimates to interpret the results. However, as the model starts getting complex (Black box models like neural network), it gets harder to interpret the results. It becomes an irony in that situation where you need a black box model to get better results but it becomes harder to explain the results. In addition, when you are asked to explain a model that you developed in the past, it takes certain time before you get to the answer. This fundamental drawback is addressed by SHAP (SHapley Additive exPlanations).
What you will learn from this article?
- To dockerize your model to perform real-time scoring
- Create a front-end API using Streamlit to communicate with your model and get predictions
- Use SHAP to interpret the model predictions
The entire code is available in the GitHub repository.
For this exercise, I used the bank dataset to build a binary classification model. The jupyter notebook will walk you through the steps to create the objects for the pickle file. In this exercise, we store 4 objects in the pickle file.
- d — Label encoder object for converting categorical data to numeric data
- features_selected — Features used in the classification model
- clf — Random forest classifier model
- explainer — SHAP explainer object
Once you have the pickle file ready, you can proceed with the API creation.
Step1: Dockerize your model to perform real-time scoring
helper.py
This file contains the helper functions to perform the scoring. When you get the raw data, it needs to be processed and make it ready for scoring. This is achieved by the transform_categorical function. Once, the data is processed, we can score the data using the score_record function. This function returns the probability and prediction which will be later shown in the Front end API.
app.py
This flask app is used to read your model objects and produce the scores. First, we read the pickle file created before (score_objects.pkl) and load the model objects. Second, we get the data from the Streamlit front end API in json format. Third, we use the helper functions to perform preprocessing and produce the scores. Finally, we sent back the scores to Streamlit front end API.
requirements.txt
This file has the list of required packages to perform the operations mentioned above.
Dockerfile
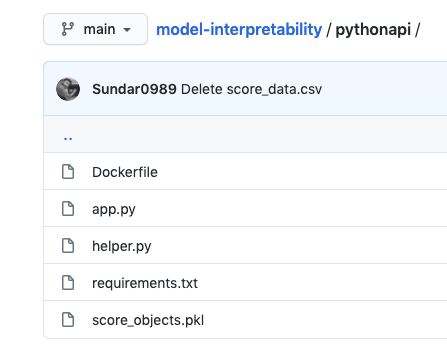
This file is used to create a docker for your model and containerize the entire application. As you can seem, it takes a base image (python:3.7-stretch) and creates a work directory inside the image (/deploy/). We copy the files mentioned before (app.py, requirements.txt, helper.py and score_objects.pkl) to the work directory. It installs the packages in the requirements.txt file inside the image (Line 7) and exposes the port 5000 to outside wold. When flask is executed (Line 9) it will use this port to communicate with the outside applications. If you need to use a different port, then configure the port in the app.py file.
All these files reside in a directory called pythonapi.
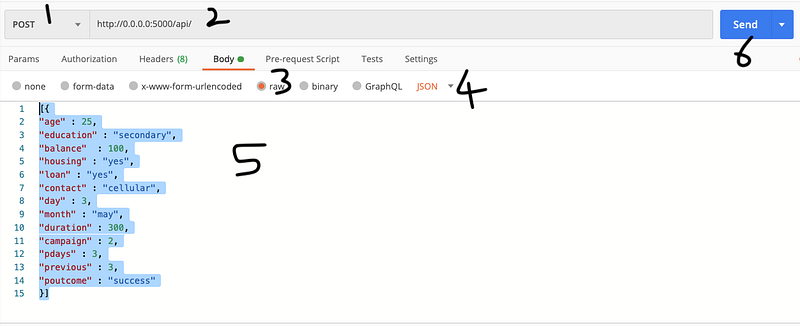
Note: Before you create the docker container, you can test your application by running the app.py file separately. This will avoid unnecessary errors and helps in code debugging. I would recommend using Postman API for this task.
Debugging the application using Postman API
You need to make sure to follow the steps to setup the Postman API.
Launch your Terminal/Command prompt to execute the app.py file with the command shown below.
python app.py
After the application is launched, use the example below to verify that the application is running correctly without any errors.
You should get an output that looks like below.
After you are done with debugging, you can move to the next step to create the front end Streamlit API.
Step 2: Create a front-end API using Streamlit
The Streamlit front-end API sits in its own docker container. This way the front-end application is independent of the model docker and can be altered at any time. This is a good industry practice. The directory structure for streamlit looks like below.
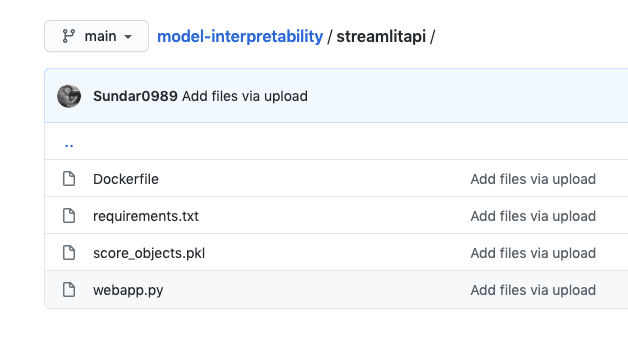
webapp.py
This file contains the codes for creating the Streamlit application. The best part of using Streamlit is you can interactively build the front end as you work and it requires minimal code. You need to make sure that the Python API endpoint points to pythonapi directory that is created before. If you used a different directory name, you need to change it to make it work.
To debug this application, you can use the code below.
streamlit run webapp.py
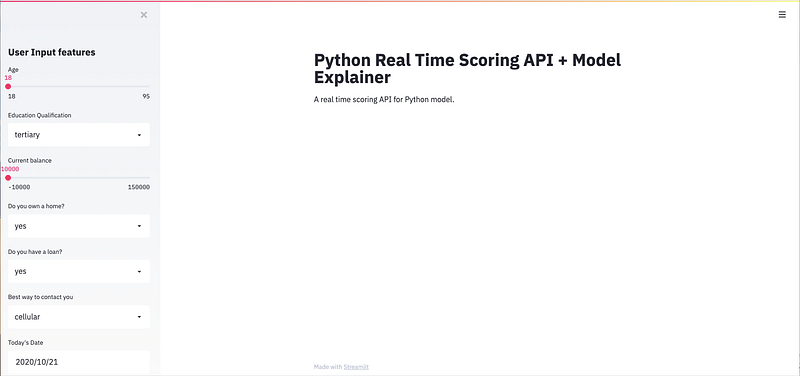
The final front end API looks like above. In this API, you can provide the input data in the left sidebar and then get the real time prediction and explanations in the main page.
requirements.py
Dockerfile
We also have the score_objects.pkl file in this directory as well to access the SHAP explainer object.
Now, we are ready to incorporate the shapley explanatory values in the API.
Step 3: Use SHAP to interpret the model predictions
The code for SHAP is already included in the webapp.py. The code below is the snippets taken from the webapp.py.
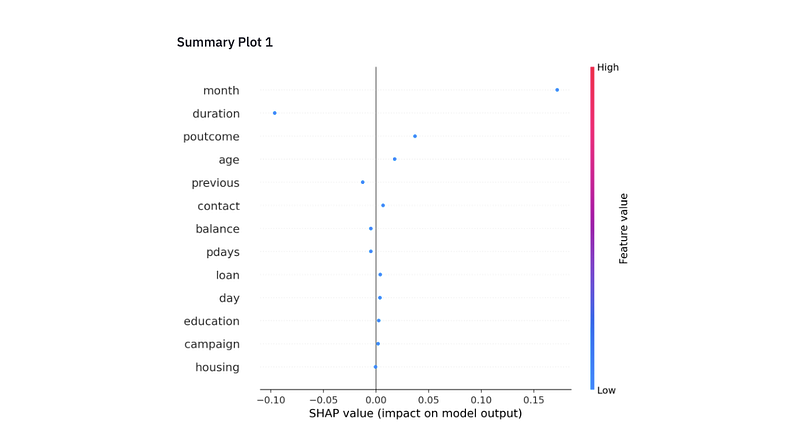
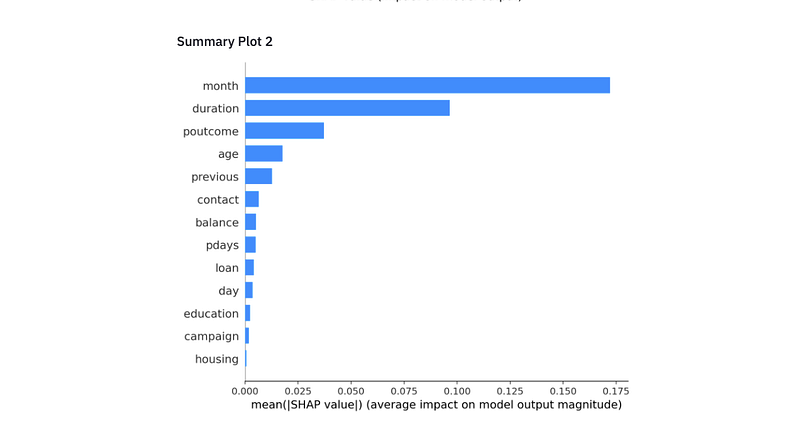
The explain_model_prediction function produces the shap values which are necessary for interpretation of results. The st_shap function takes the graph generated by force_plot object (p) and makes it compatible with Streamlit API. Finally, we have added the summary plots for each predictions.
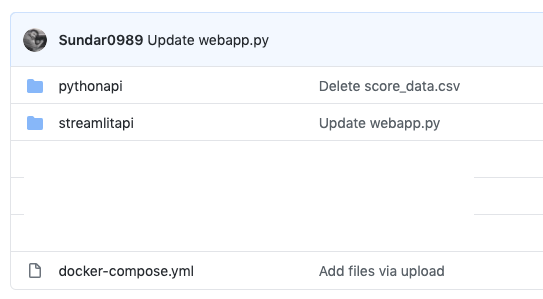
Now, we are ready with individual components, let us combine them together to make our application work. We will use docker-compose to perform this task. The code is provided below.
This is the structure of the entire directory to make this thing work.
Navigate to the Terminal/Command prompt and execute the following commands.
docker-compose build
It will build the complete image and setup the necessary connection between the model and streamlit docker. Once the step is complete, you can execute the code below to run the application.
docker-compose up
You will see the application live in the URL — http://localhost:8501/. To run the application, provide some inputs for each feature and click on the “Get predictions” button. You should get an output like below.
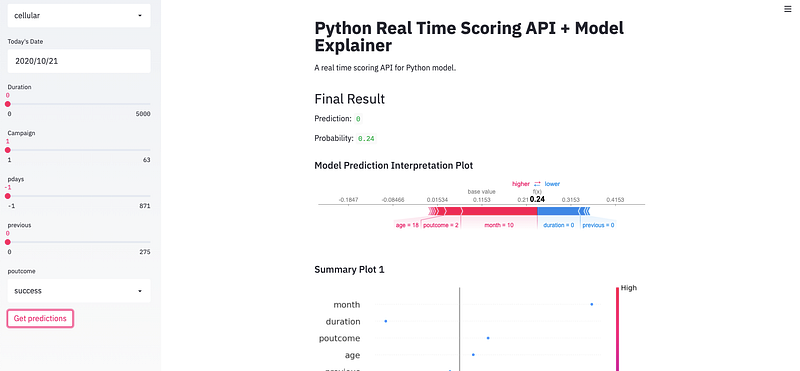
Along with the prediction and probability, you get a nice interpretable plot that explains why the model made that prediction. Once you are done using the API, you can shutdown using the code below.
docker-compose down
That’s it. You now have a real time model scoring and interpretation application with a nice front end. You can add/modify/remove plots as it serves your purpose/application.
Have fun!


