
Ready for scraping NGINX metrics? Nginx_vts_exporter + Prometheus + Grafana
Scrape up like a bee, take it like a spider
Nginx. One of the best solution for organizing a web-server. But once you come across a situation where the number of servers under your control leaves you with no other chance — you need to somehow track the main indicators on requests to the servers…
There is a rather large variety of approaches to organizing the collection of nginx metrics: embedded functionality in nginx+, own tools from puma, fast surface solutions like nginx_prometheus_exporter deployed by docker, third-party libraries for frameworks.
Let’s take as a basis the mini-server for collectiong metrics, offered on the official Prometheus website — nginx_vts_exporter.
Nginx virtual host traffic status exporter …why ?
And really why? After all, we could raise nginx_prometheus_metrics using docker and maybe it would be faster and easier. However, deploying nginx_vts_exporter will open the magic behind the scenes of the deployment of the docker container, as well as install the GO and compile the binary from the nginx_vts_exporter.go source.
Let’s dig it…
Concept
First of all, we outline the general concept for understanding the sequence of interaction of components.
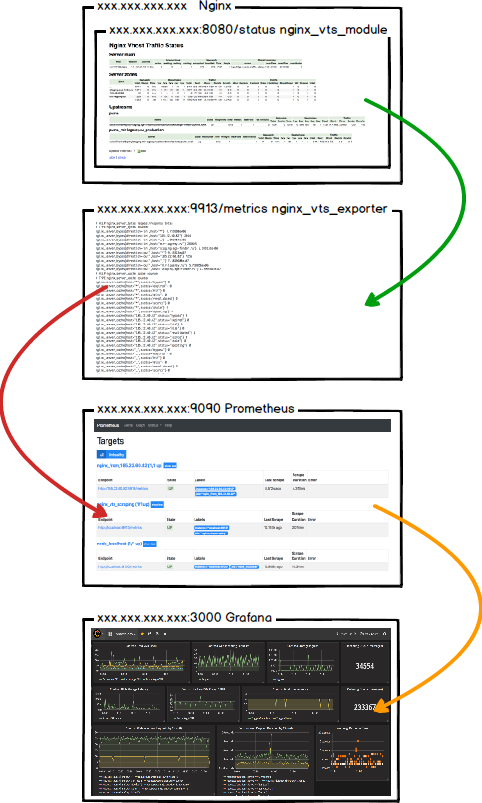
The scheme is quite simple and logical. Well, let’t start with the first step and analyze nginx_vts_module.
Step 1. Compile Nginx with virtual host traffic status module ( nginx_vts_module )
The first thing we need is to assemble NGINX on the target server with a module for displaying metrics. For this you have a lot of sources. I suggest to use one of them. Below is a small cheat sheet.
- Perhaps your Nginx compilation have already included vts module. You can check that by running following command:
nginx -V 2>&1 | grep -o with-http_stub_status_module- or if your installation is not in the /etc
/usr/sbin/nginx -V 2>&1 | grep -o with-http_stub_status_module- If you see the following output, you can skip the installation of this module
with-http_stub_status_moduleOtherwise…
- Download and unpack the sources of the latest version of Nginx
cd /opt/ \
    && wget https://nginx.org/download/nginx-1.13.5.tar.gz \
&& tar xf nginx-1.13.5.tar.gz- Get the latest stable version code of the nginx-module-vts
curl -fSL https://github.com/vozlt/nginx-module-vts/archive/v0.1.15.tar.gz | tar xzf - -C /tmp- Maybe you are stuck in a few non-pre-installed libraries… Maybe not
Make
sudo apt-get install — reinstall makePCRE
apt–get install libpcre3apt–get install libpcre3–devZLIB
sudo apt install zlib1gsudo apt install zlib1g-devOPENSSL
sudo apt install build-essential checkinstall zlib1g-dev -ysudo apt-get install -y — no-install-suggests libluajit-5.1-dev libpam0g-dev zlib1g-dev libpcre3-dev libssl-dev libluajit-5.1-dev libpam0g-dev zlib1g-dev libpcre3-dev libexpat1-dev git curl build-essential- Compile Nginx from source with required modules
./configure \
    --prefix=/etc/nginx \
    --sbin-path=/usr/sbin/nginx \
    --modules-path=/usr/lib/nginx/modules \
    --conf-path=/etc/nginx/nginx.conf \
    --error-log-path=/var/log/nginx/error.log \
    --http-log-path=/var/log/nginx/access.log \
    --pid-path=/var/run/nginx.pid \
    --lock-path=/var/run/nginx.lock \
    --http-client-body-temp-path=/var/cache/nginx/client_temp \
    --http-proxy-temp-path=/var/cache/nginx/proxy_temp \
    --http-fastcgi-temp-path=/var/cache/nginx/fastcgi_temp \
    --http-uwsgi-temp-path=/var/cache/nginx/uwsgi_temp \
    --http-scgi-temp-path=/var/cache/nginx/scgi_temp \
    --user=nginx \
    --group=nginx \
    --with-http_ssl_module \
    --with-http_realip_module \
    --with-http_addition_module \
    --with-http_sub_module \
    --with-http_dav_module \
    --with-http_flv_module \
    --with-http_gunzip_module \
    --with-http_gzip_static_module \
    --with-http_random_index_module \
    --with-http_secure_link_module \
    --with-http_stub_status_module \
    --with-http_auth_request_module \
    --with-threads --with-stream \
    --with-stream_ssl_module \
    --with-http_slice_module \
    --with-mail \
    --with-mail_ssl_module \
    --with-file-aio \
    --with-http_v2_module \
    --with-cc-opt='-g -O2 -fstack-protector-strong -Wformat -Werror=format-security -Wp,-D_FORTIFY_SOURCE=2' \
    --with-ld-opt='-Wl,-Bsymbolic-functions -Wl,-z,relro -Wl,--as-needed' \
--add-module=/tmp/nginx-module-vts-0.1.15- And if compilation is completely succesfull make it. If not — install missed libraries and make it again.
makemake installservice nginx restartDynamic compilation
There is also another way to include nginx-module-vts in your nginx build. We followed the path of compiling a static module inside nginx. Now let's discuss the dynamic addition of a module.
Let’s take the main variant when nginx was installed from sources.
- Before all we need to check that our sources.list includes official nginx source. Get to /etc/apt/sources.list with your favourite editor and add this strings right before all data inside
deb http://nginx.org/packages/ubuntu/ bionic nginx
deb-src http://nginx.org/packages/ubuntu/ bionic nginx
...- Great. Now we are ready to get source code of nginx using official source. Here is a little cheat sheet
cd /tmpsudo mkdir nginx_source_code
apt source nginx- Also take module
git clone git://github.com/vozlt/nginx-module-vts.git- Finally build it
cd ./nginx-1.15.0
./configure --with-compat --add-dynamic-module=../nginx-module-vts/
make modules
cp objs/ngx_http_vhost_traffic_status_module.so /etc/nginx/modules/
Hope we did it! Let’s move on…
Step 2. Location opening for researching metrics
On that stage we configures target server with Nginx for showing metrics in some location path. E.g. we are going to open location [target_server_ip]/status on 8080 port. No need to strictly adhere to names. You could change them for your own configuration. ( other port or location path)
- In the http section of the /etc/nginx/nginx.conf configuration file, add the following line
http {
    vhost_traffic_status_zone;
    ...
}- Or if you added module dynamically check that module included
load_module modules/ngx_http_vhost_traffic_status_module.so;...http {
vhost_traffic_status_zone;
...
}If you collates with situation when configuration test fail (sudo /usr/sbin/nginx -t) try to jump backward step and choose the path of compilation with dynamic module
- In the server section, we proxing outside requests for 8080 port on /status location. This is a basic configuration. All available directives and usage examples here.
server {
 listen 8080;
 listen [::]:8080;
location / {
} location /status {
vhost_traffic_status_display;
vhost_traffic_status_display_format html;
}
}- By the way, if you going to deny any outside requests and open location only for internal server scraping you could add some lines. It is optional for start.
...location /status {...
allow any_ip_address; # E.g. localhost ip address
deny all;
}
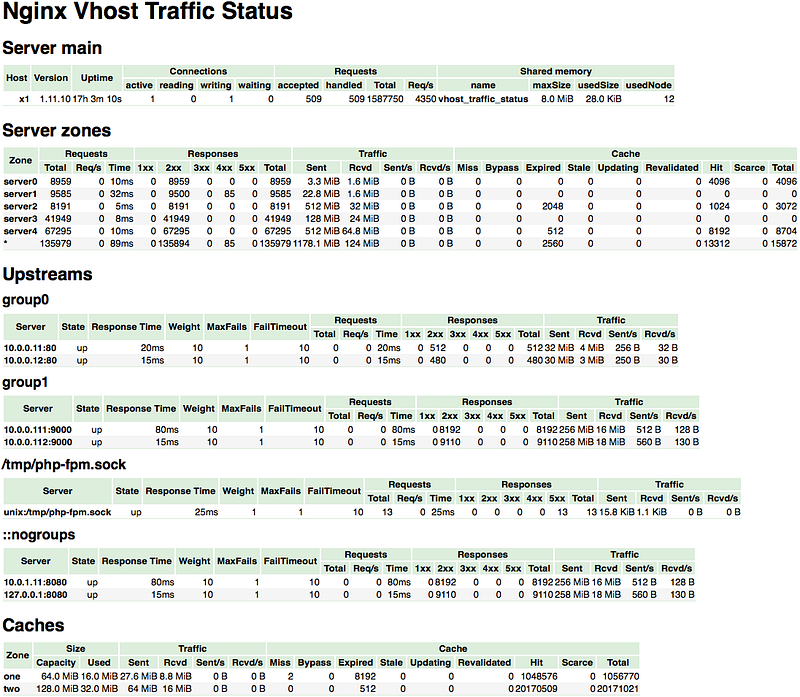
...Good! Another success step to the goal… I believe that you will complete this part without issues. As a result, going to xxx.xxx.xxx.xxx:8080/status should discover a similar interface:
Step 3. Golang installation and launch mini-server for exporter
Fine. Metrics are collected. However, after restarting nginx, the collected data will be reset and all unsaved data will be irretrievably lost. Looking ahead, it is worth noting that we will use Prometheus to collect and maintain history of metrics.
But let’s not hurry. In order for metrics to be collected by Prometheus, they must be converted to format that can be recognized by Prometheus. Looks like nginx_vts_exporter is ready for action. Indeed it is. Launching this mini-server helps to convert metrics to needable format. But the step before we will install GO and compile binary from go file.
Installing the GO happens rather quickly with only a few configuration options. There are enough sources in this area. E.g. this one is all fairly briefly and accurately painted.
Only one thing that i want to adds from myself that $GOPATH variable includes path with bin folder. This folder will contain our binary file which we will create by go install command. But all in order!
- Download go binary from source or directly. At the time of this writing, the last stable version was v0.10.4
wget https://github.com/hnlq715/nginx-vts-exporter/archive/v0.10.4.tar.gz- And now time we extract archive and move to the extracted folder and then to the bin folder deeper. Inside that folder we are interesting at only one go file — nginx_vts_exporter.go. When we will run the “go install” command, the binary file will compile into the $GOPATH/bin directory. ( this issue was discussed a little higher )
tar -xzvf v0.10.4.tar.gz
cd nginx-vts-exporter-0.10.4/bin
go install nginx_vts_exporter.go
We are not pursuing a goal in mastering the GO language. If you want to understand the details of the language dig the official resource.
- Move the compiled binary to the /usr/local/bin directory
sudo cp $GOPATH/bin/nginx_vts_exporter /usr/local/bin- Create user for exporter without home folder
sudo useradd — no-create-home — shell /bin/false nginx_vts_exporter- And let’s create systemd service for background launch
sudo touch /etc/systemd/system/nginx_vts_exporter.service- Put this inside and save
[Unit]
Description=Nginx vts exporter
Wants=network-online.target
After=network-online.target
[Service]
User=nginx_vts_exporter
Group=nginx_vts_exporter
ExecStart=/usr/local/bin/nginx_vts_exporter -nginx.scrape_uri=http://localhost:8080/status/format/json
Restart=always
RestartSec=3
[Install]
WantedBy=default.target
ExecStart point is the option where we configure options for launch our mini-server for exporting metrics. Just follow this pattern:
ExecStart=/usr/local/bin/nginx-vts-exporter -nginx.scrape_uri=http://xxx.xxx.xxx.xxx:8080/status/format/json
xxx.xxx.xxx.xxx is the ip address of the server with nginx_vts_module. Accordingly, we set the port number the same as when configuring nginx_vts_module in the previous step. Also take a look at the path — …/status/format/json. You could try it on your server. The result will be the output of metrics in JSON format. By this format the metrics arrive in nginx_vts_exporter.
- Now when the systemd service was created let launch it
sudo systemctl daemon-reload
sudo systemctl enable nginx_vts_exporter
sudo systemctl start nginx_vts_exporter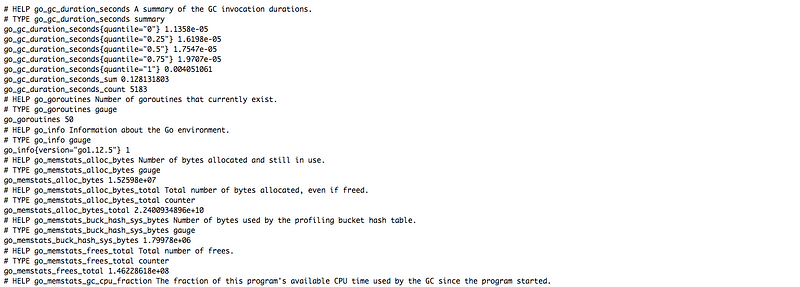
sudo systemctl status nginx_vts_exporter- If successful, go to xxx.xxx.xxx.xxx:9913/metrics and check your work ( cause nginx_vts_exporter starts at 9913 port at path /metrics by default ). The output should look like this:

Step 4. Gotta catch em all. Scraping metrics with Prometheus
Prometheus is an open time series of DBMSs written in Go and originally developed by SoundCloud. In other words, this thing keeps your metrics.
If you wanna increase your knowledges in Prometheus then visit official resource. Here you could find all needable info to start your first Prometheus server.
Here is a cheatsheet if you don’t want to read Prometheus docs. We will also add prometheus to the systemd service for background launch. Before you start installation choose the freshest source of Prometheus here.
sudo useradd — no-create-home — shell /bin/false prometheus

wget https://github.com/.../prometheus-2.10.0.linux-amd64.tar.gz
tar -xvzf prometheus-2.10.0.linux-amd64.tar.gz
sudo cp prometheus-2.10.0.linux-amd64/prometheus /usr/local/bin/
sudo cp prometheus-2.10.0.linux-amd64/promtool /usr/local/bin/sudo mkdir /etc/prometheus
sudo cp -r prometheus-2.10.0.linux-amd64/consoles/ \
/etc/prometheus/consoles
sudo cp -r prometheus-2.10.0.linux-amd64/console_libraries/ \
/etc/prometheus/console_libraries
sudo cp prometheus-2.10.0.linux-amd64/prometheus.yml \
/etc/prometheus/
sudo chown -R prometheus:prometheus /etc/prometheussudo mkdir /var/lib/prometheus
sudo chown prometheus:prometheus /var/lib/prometheus- Make changes to /etc/prometheus/prometheus.yml, indicating where to look for nginx_vts_exporter.
It’s important! Tabs are not allowed in YAML files. Only two spaces are used to delimit nesting.
Inside job named ‘nginx_vts_exporter’ (or any else name) in block static_configs we set targets for scraping metrics. Note that we set the target path without the full path to xxx.xxx.xxx.xxx:9913/metrics. There is a reason for this. By default, the metrics path for the target server is set to …/metrics. You can change it if you like by specifying metrics_path. This time we set only one target server. But you could set any number of targets you want to scrape.
- This is for one target (this is what we need):
scrape_configs:
  — job_name: ‘prometheus’
    # leave it unchanged
  — job_name: ‘nginx_vts_exporter’
    # metrics_path defaults to '/metrics'
    # scheme defaults to 'http'.
    static_configs:
— targets: [‘xxx.xxx.xxx.xxx:9913’]- Or more:
scrape_configs:
  — job_name: ‘prometheus’
    # leave it unchanged
  — job_name: ‘nginx_vts_exporter’
    static_configs:
    — targets: [‘xxx.xxx.xxx.xxx:9913’, 'yyy.yyy.yyy.yyy:9913', ...]
...- Also for more jobs:
scrape_configs:
  — job_name: ‘prometheus’
    # leave it unchanged
  — job_name: ‘some job 1’
    ...
  — job_name: ‘some job 2’
    ...
  — job_name: ‘some job 3’
    ...
A piece of cake, isn’t it ?
- After all done we could create systemd service for prometheus. It is rather same as for nginx_vts_exporter
sudo touch /etc/systemd/system/prometheus.service- And save it inside:
[Unit]
 Description=Prometheus
 Wants=network-online.target
 After=network-online.target

 [Service]
 User=prometheus
 Group=prometheus
 ExecStart=/usr/local/bin/prometheus \
 — config.file /etc/prometheus/prometheus.yml \
 — storage.tsdb.path /var/lib/prometheus/ \
 — web.console.templates=/etc/prometheus/consoles \
 — web.console.libraries=/etc/prometheus/console_libraries

 [Install]
WantedBy=default.target- Finally, start the service and add it to startup
sudo systemctl daemon-reload
sudo systemctl start prometheus
sudo systemctl status prometheus
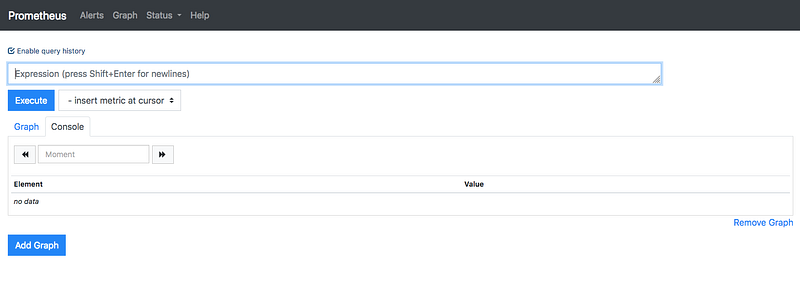
sudo systemctl enable prometheusGreat! You’ve done a lot of work! And now we are be able to watch our prometheus metrics. You could investigate prometheus interface on xxx.xxx.xxx.xxx:9090 or jump to the certain data on path xxx.xxx.xxx.xxx:9090/metrics. Let’s take a look.
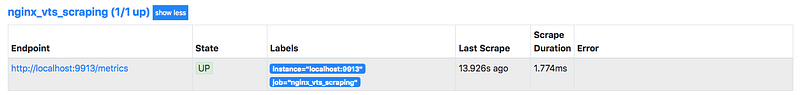
In the interface of Prometheus, you could move on the path xxx.xxx.xxx.xxx:9090/targets. Here you are be able to check the target servers which we have installed earlier in the file prometheus.yml. They must be on up state.
It is all we need for basic start of Prometheus server. But it takes two to tango… One of the best way for visualize metrics is Grafana. Let’s go to the final part.
Step 5. Almost done. Grafana visualization
Grafana is an open (Apache 2.0) web front-end to various time series DBMSs, such as Graphite, InfluxDB, and of course Prometheus.
Detailed information on installing and running the Grafana application you can find here.
- Carrying on tradition let’s find our fresh deb packet with Grafana here. Download and install. As you may have noticed the Grafana service was prepared for launch during installation. We just enable and start service.
wget https://dl.grafana.com/oss/release/grafana_6.2.5_amd64.deb
 sudo apt install ./grafana_6.2.5_amd64.deb
 sudo systemctl start grafana-server
 sudo systemctl status grafana-server
 sudo systemctl enable grafana-server
Remember that grafana runs on port 3000 by default. Same port as puma app also by default.
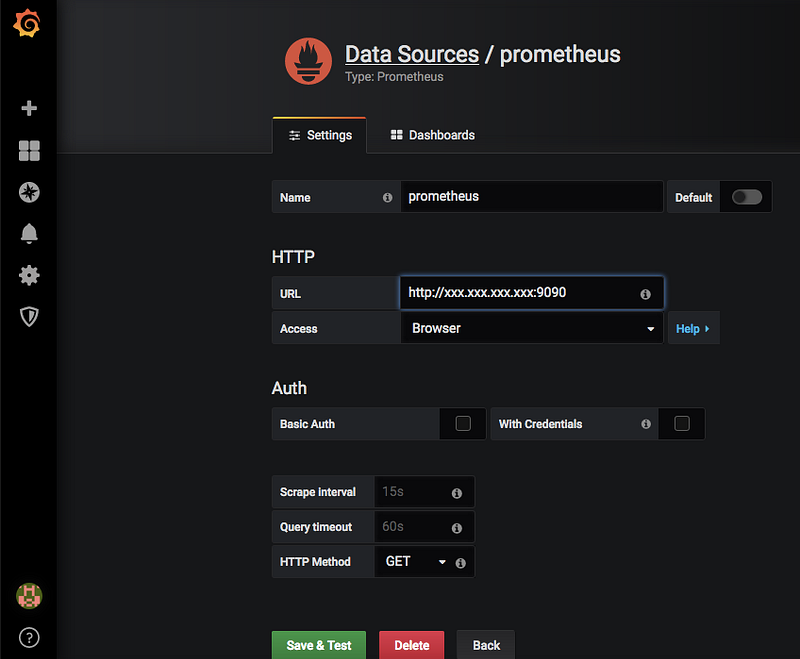
And now move on xxx.xxx.xxx.xxx:3000 using login/password pair — admin/admin. Grafana ask to change the default password. Next we jump through uncomplicated dialogues, and add Prometheus server as a data source.
- The following picture is for a small cheat sheet. Just replace xxx.xxx.xxx.xxx:9090 with your server’s ip
You could create your own dashboard from the very base. On the other hand, the Graphan community suggests ready dashboards for start scraping your metrics straight from the box without loosing time for creation. Just follow http://your-grafana-host:3000/dashboard/import
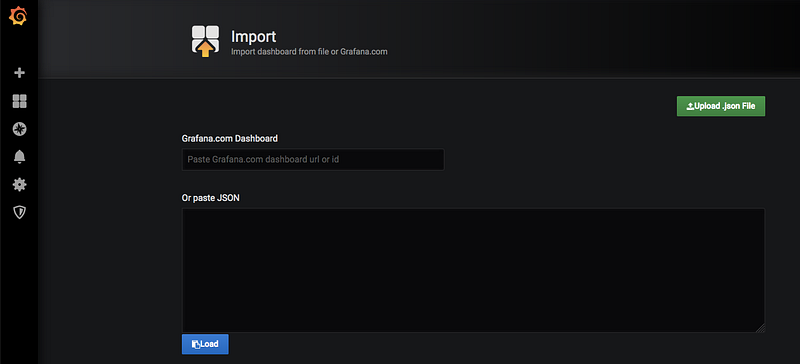
No matter what you choose — id typing or json file adding. Same result. Prefer the first variant.
- Our dashboard has attached to 2949 id. Type 2949 in the first input field and click on the next input field. One or two seconds later you receive this interface
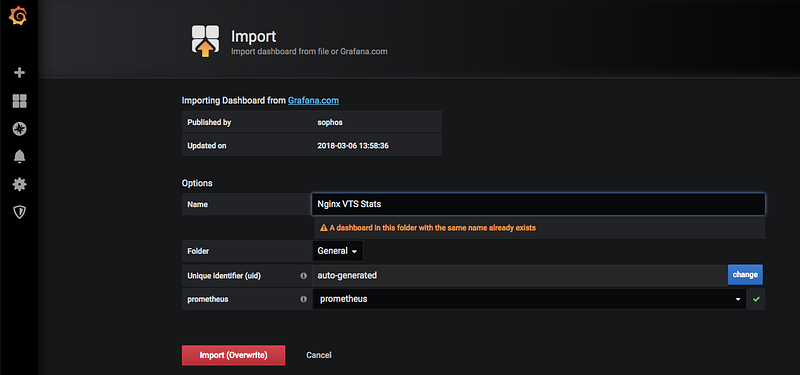
As you can notice i has this dashboard. That is why warning info me about that. Also the button ‘Import’ has the added text ‘(overwrite)’. Just ignore it.
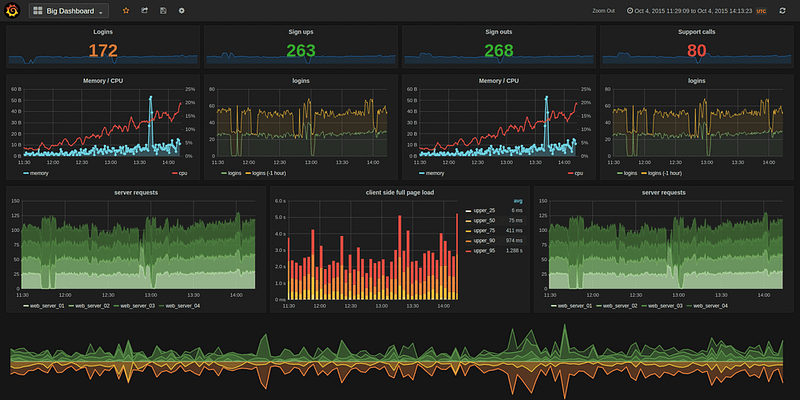
- Choose the data source created in the step before on dropdown named ‘prometheus’ and click button ‘import’ and see the result through the long steps of work done
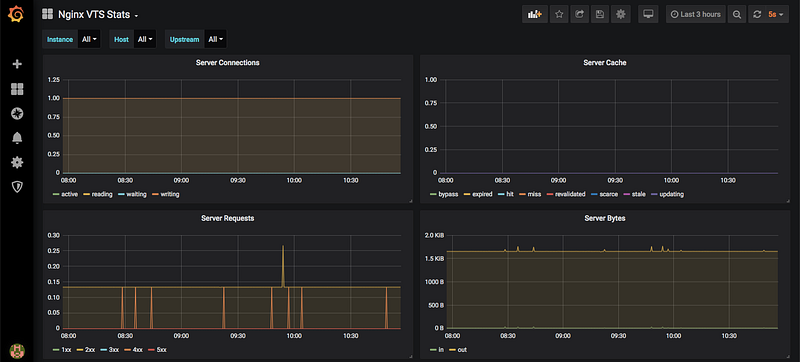
A little bit researching and you will recognize that this interface is a pretty simple. When you read this someone has already started to customize his own dashboard.
Try to collect ten words to calculate the magic conclusion
Of course, we do not investigate all the possible functionalities in this article. It is on your own.. or maybe in the next article.
We have received the simplest path to the goal and take a look on the ‘underwear’ of this technology bundle suit.
Hope we have reached the final together through this article.
Code bless you…


