
React Native Donut Chart | SVG | D3
Create Donut chart using Svg and D3 in React Native

What is Donut Chart?
A donut chart is a type of data visualization that is similar to a pie chart but with a hole in the center. It’s essentially a ring divided into sections, where each section represents a proportion of the whole data set. Donut charts are useful for displaying categorical data and comparing the sizes of different categories.
Lets create a simple donut chart in React Native:
First create a component called donut
How I prefer to create components
– components
– – charts
– – – donut
– – – – index.tsx
– – – – donut.test.ts
We will make another story for the best folder structure for most type of the type of projects
First of all create component for Donut chart:
import React, { useMemo, memo } from “react”;
import { View, StyleSheet } from “react-native”;
const Donut = () => {
const component = () => (
<View style={styles.wrapper}>
</View>
);
return useMemo(component, dependancies)
}
export default memo(Donut);
const styles = StyleSheet.create({
wrapper: {}
})Then, import Donut component in the App.js
import React from “react”;
import { Donut } from “@componnets/charts”;
import donutData from “@data/donut.json”
const App = () => <Donut data={donutData} />;
export default App;Now install svg and d3 packages
- yarn add react-native-svg d3
Then run,
- yarn pod
Now we are ready to create Donut chart 😃
- Prepare json data for the chart and convert that data into pie data using d3 for arc
const donutData = [
{
id: 1,
title: ‘first’,
value: 7,
color: randomColor(),
},
{
id: 2,
title: ‘second’,
value: 50,
color: randomColor(),
},
{
id: 3,
title: ‘third’,
value: 13,
color: randomColor(),
},
{
id: 4,
title: ‘fourth’,
value: 20,
color: randomColor(),
},
{
id: 5,
title: ‘fifth’,
value: 10,
color: randomColor(),
}
];// now convert above data for pie chart
const pieGenerator = d3.pie<any, DataItem>().value(d => d.value);Now, we can create new array from it as we want
const arcPathGenerator = d3.arc();
const pieD = pie?.map?.((item, index) => {
return {
...item?.data,
arc: arcPathGenerator({
innerRadius: size / 2.2,
outerRadius: radius,
startAngle: item.startAngle,
endAngle: item.endAngle,
}),
};
});
return pieD;Here, we have created arc from the pie data along with other donut data (title, value etc), and conditioned inner and outer radius according to selected arc
return (
<View style={styles.wrapper}>
<Svg width={size} height={size} viewBox={`0 0 ${size} ${size}`}>
<G transform={`translate(${size / 2}, ${size / 2})`}>
{arcs.map((item, index) => {
return (
<Path
key={index}
d={item?.arc}
fill={item?.color}
onPress={() => clickHandler(item, index)}
/>
);
})}
</G>
</Svg>
</View>
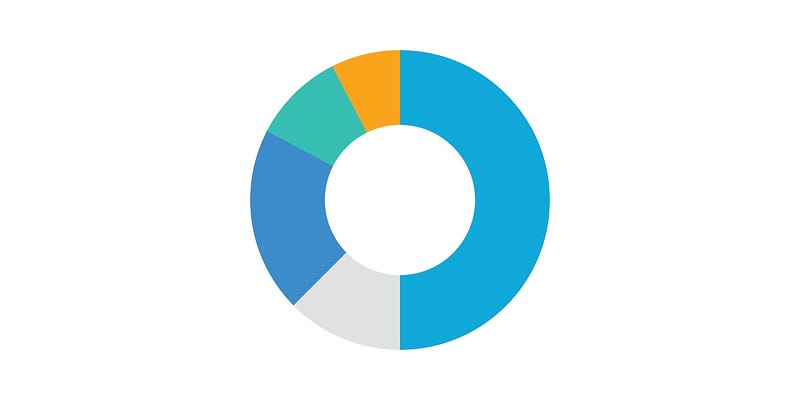
);Map arcs data with Path with size props as above 👆🏻
Our simple donut chart is Ready 😎🍩
Further more we can add, arc selection to highlight specific arc of donut chart and show the percentage of that arc,
Create state for selected arc
const [selectedArc, setSelectedArc] = useState<object | undefined>(undefined);Modify pieD variable’s logic as below
const arcPathGenerator = d3.arc();
const pieD = pie?.map?.((item, index) => {
return {
...item?.data,
arc: arcPathGenerator({
innerRadius:
selectedArc?.id === item?.data?.id
? size / 2.2 + diffGap
: size / 2.2,
outerRadius:
selectedArc?.id === item?.data?.id ? radius + diffGap : radius,
startAngle: item.startAngle,
endAngle: item.endAngle,
}),
};
});
return pieD;And add onPress to Path and pass item to it
return (
<Path
key={index}
d={item?.arc}
fill={item?.color}
onPress={() => clickHandler(item, index)}
/>
);And set item to selectedArc state
const clickHandler = (arc, i) => {
setSelectedArc && setSelectedArc(prev => (prev?.id === arc?.id ? undefined : arc));
};When we click on any arc we display it as selected and display its percentage center
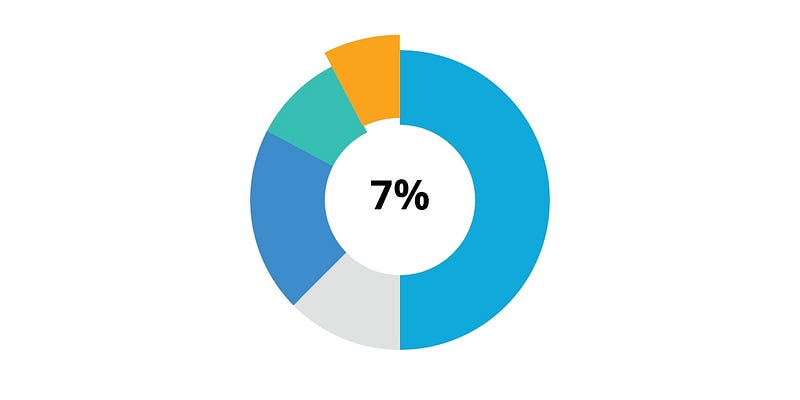
Here’s the full source code of donut.tsx
import React, { useMemo, memo } from “react”;
import { View, StyleSheet } from “react-native”;
import { useTheme } from ‘@react-navigation/native’;
import { G, Path, Svg } from ‘react-native-svg’;
import * as d3 from ‘d3';
import { AppText } from ‘@components’;
import { modarateHeight } from ‘@utils/responsive’;
import { colors } from ‘@theme’
type DonutProps = {
size: number;
data: object[];
};
const diffGap = modarateHeight(0.3);
const Donut = ({ size, data }: DonutProps) => {
const radius = Math.min(size, size) / 4
const pie = useMemo(() => {
if (data?.length > 0) {
const pieGenerator = d3.pie<any, DataItem>().value(d => {
return d.value;
});
return pieGenerator(data);
}
}, [data]);
const arcs = useMemo(() => {
if (pie?.length > 0) {
const arcPathGenerator = d3.arc();
  const pieD = pie?.map?.((item, index) => {
    return {
      ...item?.data,
      arc: arcPathGenerator({
        innerRadius:
          selectedArc?.id === item?.data?.id
            ? size / 2.2 + diffGap
            : size / 2.2,
        outerRadius:
          selectedArc?.id === item?.data?.id ? radius + diffGap : radius,
        startAngle: item.startAngle,
        endAngle: item.endAngle,
      }),
    };
  });

  return pieD;
}
}, [radius, pie, selectedArc]);
const clickHandler = (arc, i) => {
setSelectedArc(prev => (prev?.id === arc?.id ? undefined : arc));
};
const component = () => (
<View style={styles.wrapper}>
<Svg width={size} height={size} viewBox={`0 0 ${size} ${size}`}>
<G transform={`translate(${size / 2}, ${size / 2})`}>
{arcs.map((item, index) => {
return (
<Path
key={index}
d={item?.arc}
fill={colors?.[index]}
onPress={() => clickHandler(item, index)}
/>
);
})}
</G>
</Svg>
{selectedArc && (
<AppText
label={`${Math.abs(selectedArc?.value).toFixed(1)}%`}
style={styles.label}
medium
/>
)}
</View>
);
if (!arcs || arcs?.length <= 0) return null;
return useMemo(component, dependancies)
}
export default memo(Donut);
const styles = StyleSheet.create({
wrapper: {
flex: 1,
justifyContent: 'center',
alignItems: 'center',
},
label: {
position: 'absolute',
color: colors.text,
},
})Happy coding 😊


