
Ratings of 1,200 coffee blends explained with Machine Learning
SHAP values of beans origin, price, and more
In this article, I use the dataset of about 1,200 coffee blends collected and adapted from the www.coffeereview.com website. The dataset is publicly available on Kaggle. Full details of the analysis can be found in this public Kaggle notebook.

Step 1 — data preprocessing
Here, data preprocessing consists of the following steps:
- extracting original review years;
- log10-transforming prices (x → np.log10(x)) so that $1 per 100 gram becomes 0.0, $10 per 100 gram becomes 1.0, $100 per 100 becomes 2.0, etc., and further grouping them into larger bins;
- encoding rare categorical variables (roaster name, roast type, roaster location, beans origin, and review date) with no more than 60 different categories in each column and at least 15 records in each category;
- finally, removing unused columns.
As a result, we have obtained a cleaned dataset containing 1,200 coffee blends rated from 0 to 100.
Step 2 — setting a Machine Learning model to predict coffee ratings
The data prepared with the previous step are randomly split between training and test samples, and modelled with the CatBoostRegressor model that explicitly takes into account categorical features. The root mean squared error (RMSE) of the resulting model is about 1.23 points, an improvement compared to the baseline model RMSE of about 1.50 points (assuming the same score of about 93.3 points for every coffee blend).
Step 3 — explanation of the obtained Machine Learning model
Here, we are using the SHapley Additive exPlanations (SHAP) method, one of the most common to explore the explainability of Machine Learning models. The units of SHAP value are hence in rating points.
First, we look into the span of SHAP values for top features of our interest:
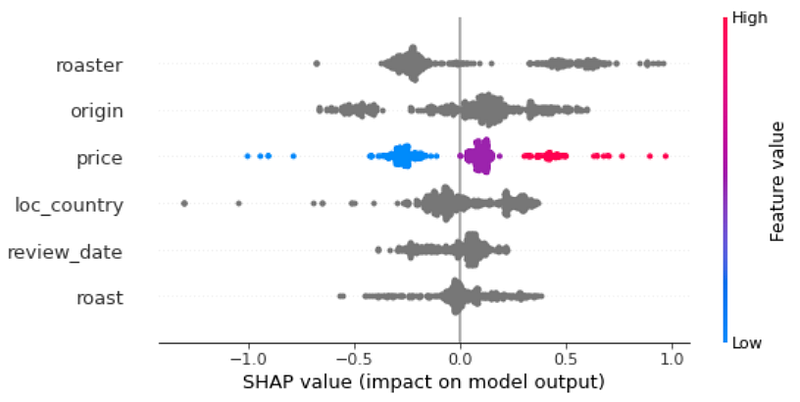
As we see, the most important features to predict ratings for coffee blends are the roaster name, beans origin, price, roaster location, review date, and roast type.
Now, we look at individual features.
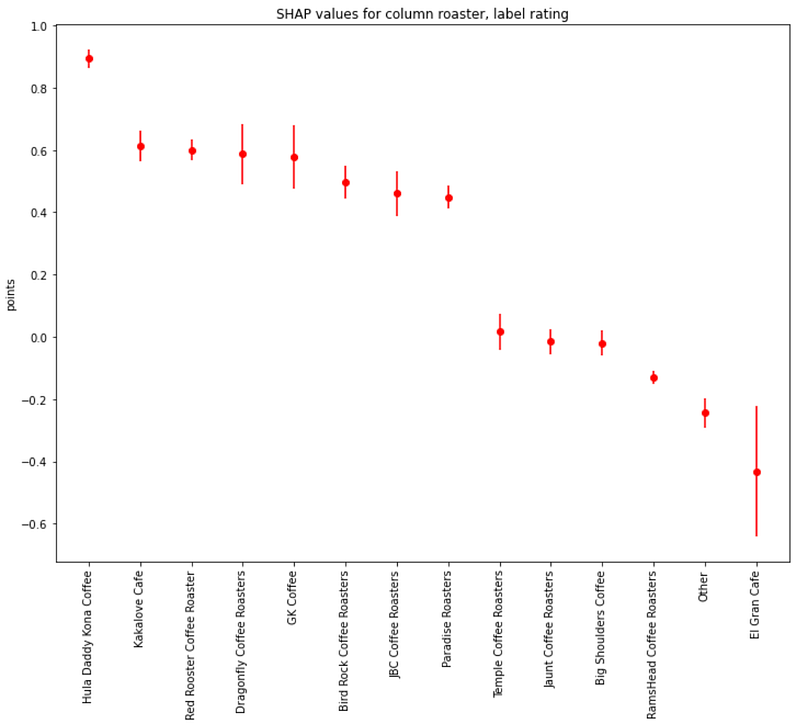
About roaster names, the highest ratings are associated with Hula Daddy Kona Coffee, followed by Kakalove Cafe, Red Rooster Coffee Roaster, Dragonfly Coffee Roasters, GK Coffee, Bird Rock Coffee Roasters, JBC Coffee Roasters, and Paradise Roasters:
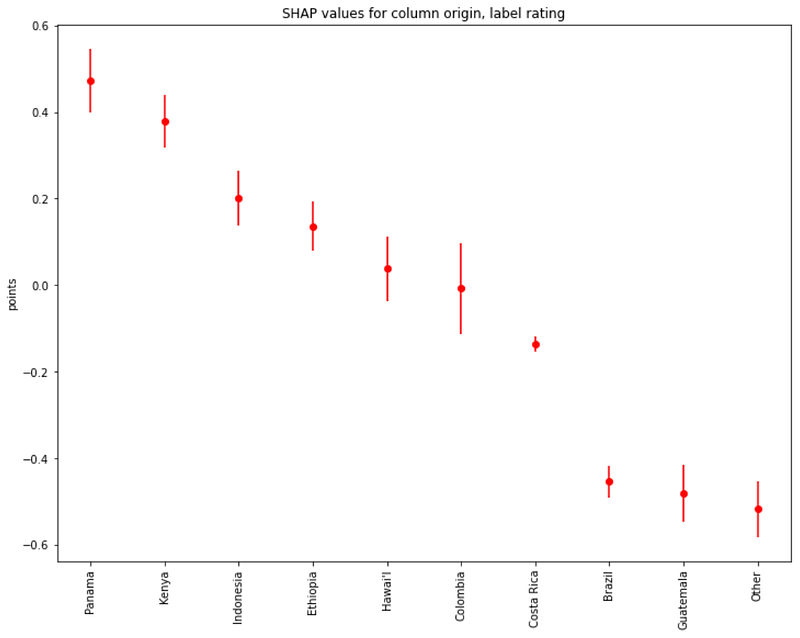
Regarding beans origins, we see that the highest ratings are associated with Panama, followed by Kenya, Indonesia, and Ethiopia:
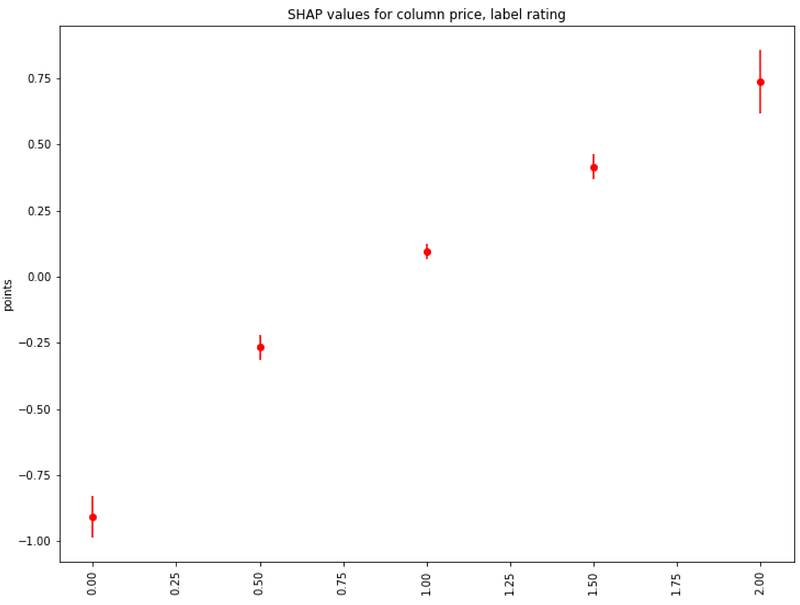
About coffee prices, not surprisingly, the highest ratings are associated with the highest prices (about 10**2 = 100 USD per 100 grams):
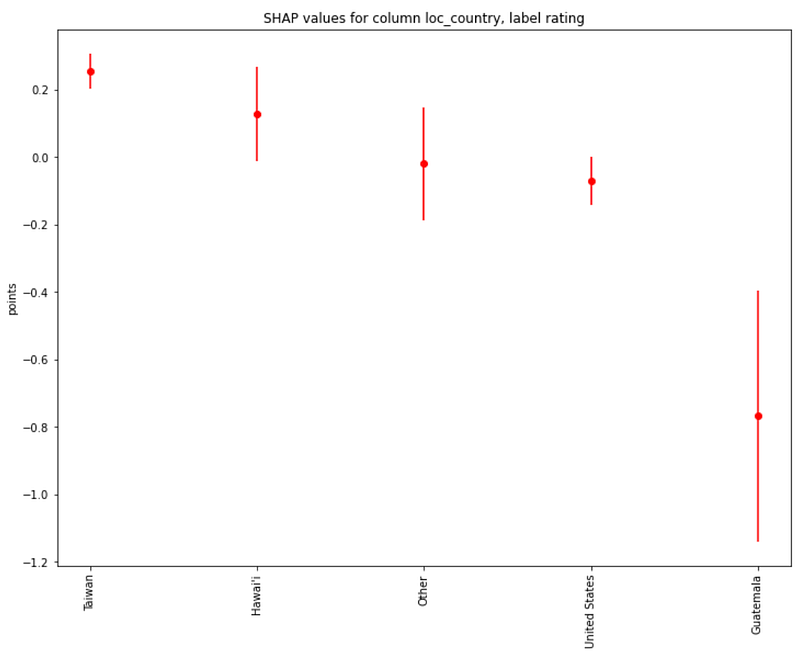
Regarding roaster locations, we see that the highest ratings are associated with Taiwan and Hawaii:
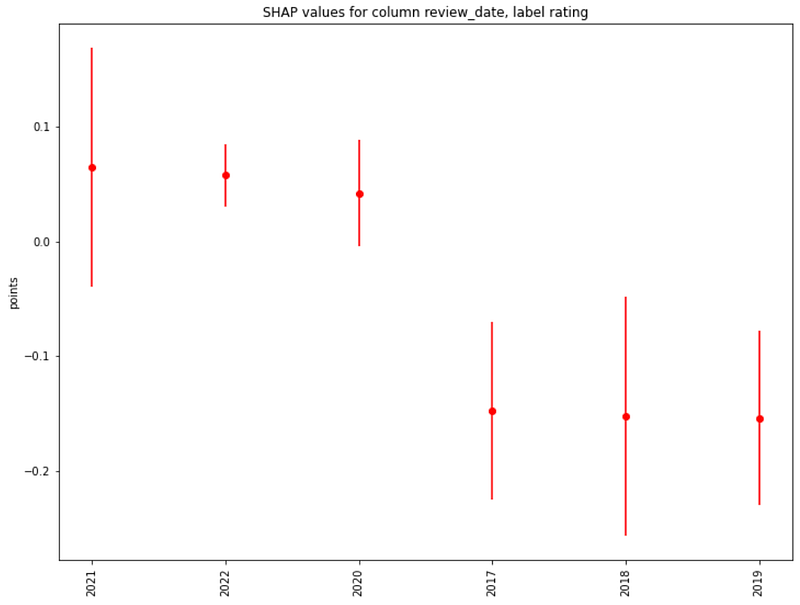
About review dates, the highest ratings are associated with the latest available reviews (2020–2022):
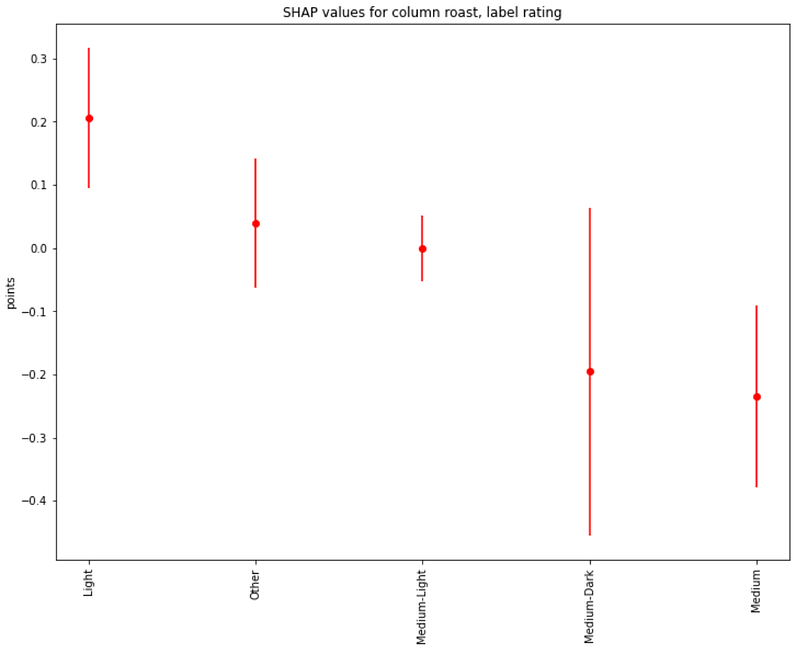
Finally, about coffee roast types, we see that the highest ratings are associated with Light and Medium-Light roast types:
I hope these results can be useful for you. In case of questions/comments, do not hesitate to write in the comments below or reach me directly through LinkedIn or Twitter.
You can also subscribe to my new articles, or become a referred Medium member.


