
Quickly Find Motley Fool Stock Picks with Python

The Motley Fool is one of my go-to resources when doing investment research. Their analysis is thoughtful and thorough, yet succinct at the same time, making it great for quickly getting up to speed on a stock. However, the process of searching and combing through articles to find stocks and understand their prospects can be time consuming and tedious — death by Google search, anyone? Fortunately, you can put those days in the rearview with Python by easily scanning multiple webpages to collect stocks that Motley Fool may be bullish on.
An overview of our Program
The idea of the program is to use a Google search, predefined by the user, to return search results and then parse those webpages to find stock symbols. To extract stock symbols from those pages, the program will use regular expressions — a sequence of characters that look for and extract certain patterns. Once those symbols have been collected, the program will then compute the one-year performance, as well as the cumulative three year return, for each stock and then assess whether each stock has beaten the S&P 500 in each of those categories. That way we have a high level benchmark of how these stocks performed relative to the S&P. The end goal, ultimately, is to quickly compile list of interesting stocks that you can easily reference and research further.
Getting started
The first thing we’ll do is import all of the packages we’ll be using:
import requests
import pandas as pd
import re
from bs4 import BeautifulSoup
import yfinance as yf
import numpy as np
from googlesearch import search
If you need to install any of these, open your command line or terminal and type pip install [package]
or conda install -c [package]
Computing One Year Performance and Cumulative Three Year Returns
Before we jump into web-scrapping, I’d like to create code that computes one-year performance and cumulative three year returns for the stocks we’ll end up collecting. Let’s start with calculating one-year performance:
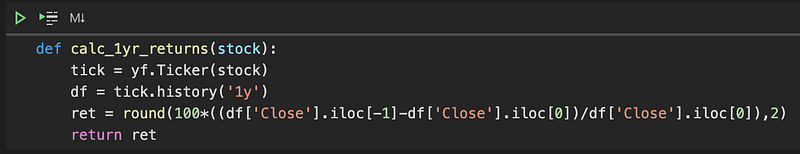
The function pulls one year’s worth of end-of-day prices, using Yahoo Finance’s API, calculates the yearly change, and then rounds the result two decimal places.
Like one-year performance, we’ll also create a function that computes three year cumulative returns:
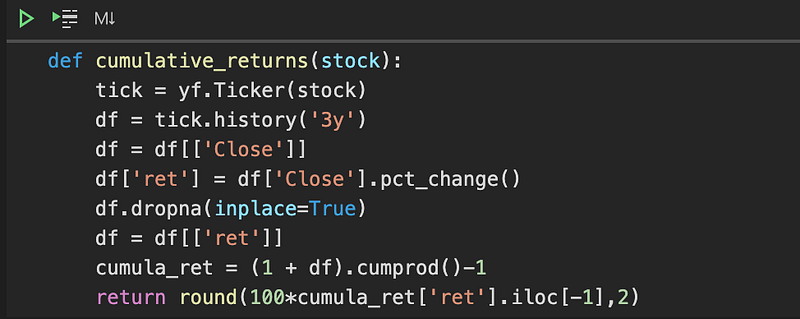
Like the one-year function, this function retrieves end-of-day stocks prices with Yahoo Finance’s API. The thing that is different here is that the function then calculates the stock’s daily returns (df[‘Close’].pct_change()) and then uses those daily returns to calculate cumulative returns over three years, using pandas’ cumprod() function.
You can test these functions out by calling them with any stock you like (demonstrated below):
cumulative_returns('TSLA')
Collecting Stocks from Motley Fool
Now that we can compute performance and returns over a period of time, we’ll need a list of stocks to apply those functions to. To compile our list, we’ll use the googlesearch library to compile search results and then use BeautifulSoup and Python’s regular expression library (re) to extract stock symbols from our search results. We’ll create a function, scrape_web, that puts this all together:
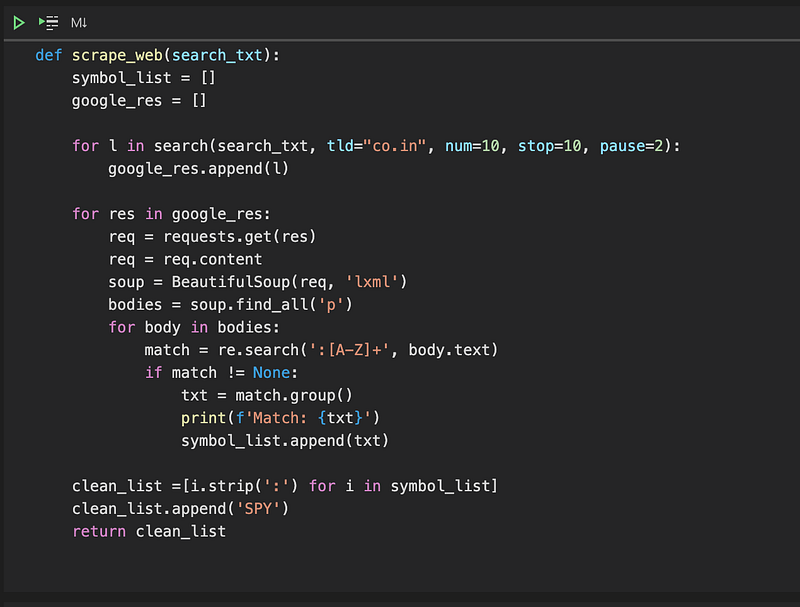
There is a lot going on here, and I’ll go through this line by line, but the main thing to understand is that the function goes through each result from a Google search and extracts stock symbols from each web page and stores them in a list. Now let’s dissect this function a little more:
symbol_list = []
google_res = []
Two empty lists are created to store stock tickers and google search results, respectively.
for l in search(search_txt, tld="co.in", num=10, stop=10, pause=2): google_res.append(l)Next a for loop is created to append each result to the google_res variable. The search function takes a Google search string (search_txt), a domain argument (tld=”co.in”), the number of results to return (num=10), the number of results to stop at (stop=10), and the time to wait before retrieving the next result (pause=2). Note, it’s highly recommended that you use the pause variable. If no pause is used, Google might block your IP address. You can read more about the search function here.
Moving on to the the next block of code:
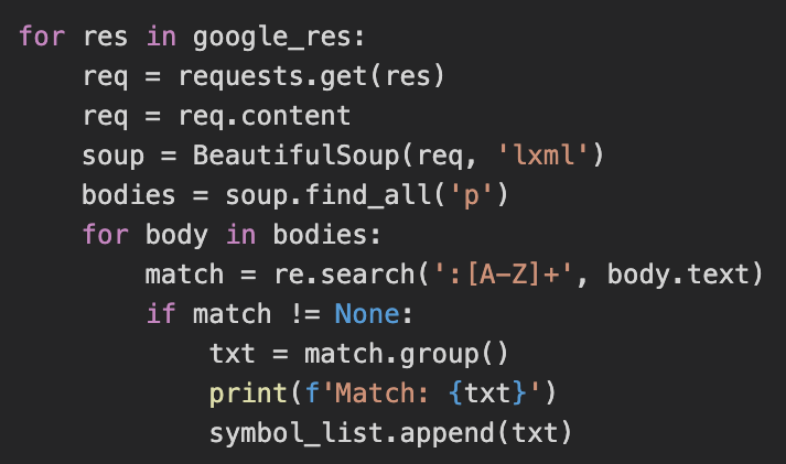
Once all of the Google search results have been collected, the script subsequently goes through each result, searching every paragraph from each page for stock symbols. Motley Fool specifies each stock in their articles with a colon followed by several capital letters, so the script uses Python regular expression library (re) to look for instances of a colon followed by all capital letters. If that pattern is found, then it is appended to our symbol_list variable.
Lastly, the last bit of code removes all colons from our tickers and appends the SPY ticker (the S&P 500 ETF) to the list so that all tickers can be used in our two performance related functions mentioned above.
Compiling our Results
At this point we can compile a list of stocks to plug into our two performance functions, but it would be nice if we can organize those results in an Excel file for easy reference. Let’s go ahead and do that:
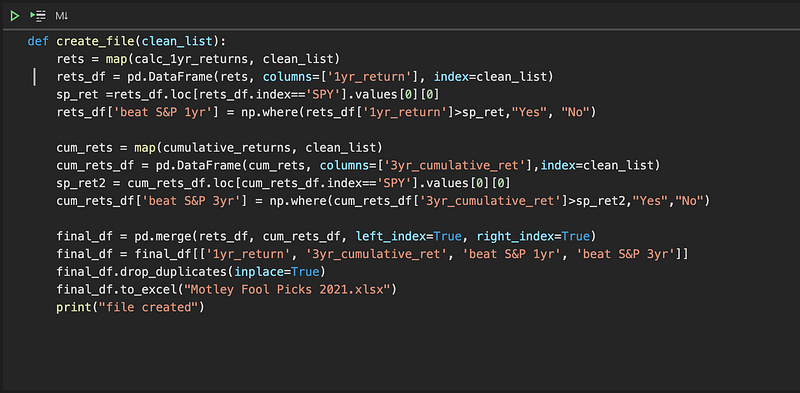
A few things to note here: the create_file functions takes a list of stocks as its argument. It then applies the two performance functions to each item in that list and subsequently creates two dataframes, each with its own performance metric, as well as assessing if each stock outperformed the S&P 500. It then merges the two dataframes together, providing a holistic view in terms of performance.
Creating an Actual Excel File
The last thing to do is creating an actual Excel file with stocks we want to research further:
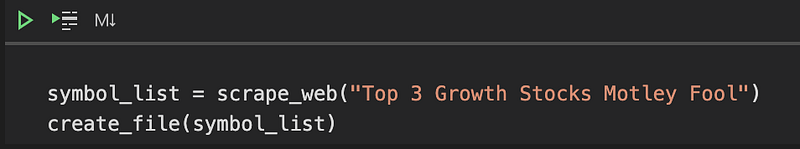
Our stock list is created by calling the scrape_web function, and then a file is subsequently created by applying the symbol_list to the create_file function. You can change the string in the scrape_web function to anything you want, by the way. Just make sure to include “Motley Fool” in the search parameter.
One Caveat to Note
One thing to be cognizant of is that every stock included in our list won’t necessarily be a stock that Motley Fool is bullish on. Remember, the script only looks for every ticker in each article. It does not provide any additional context on what the Motley Fool’s actual take on each stock is. For example, the Motley Fool may compare and contrast stocks to indicate which is the better buy. One stock will be preferred to the other, but that information will not be captured, and both will be included in our file, so it is important to do additional research to get additional color.
Conclusion
Finding the right stocks can be an overwhelming task, and it can be difficult to quickly compile and synthesize large amounts of information. In this article, we’ve married a reputable source of investing information with Python to help kick start our investing adventure in an efficient manner.
The source code can be viewed here.
Please let me know if you have any questions!


