Python Data Structures -DataFrame
Prerequisites: Basic knowledge of any programming language
we will explore Data Structure DataFrame and all its operations here.
Jupyter notebook on Dictionary available at :https://github.com/arshren/Data-Structures/blob/master/Python%20Data%20Structure-%20DataFrame.ipynb
For all operation on List read this post — https://readmedium.com/python-data-structures-list-9131e7386c8d
For all operation on Dictionary read this post — https://readmedium.com/python-data-structures-dictionary-9b746b94b421
For all operation on Tuples read this post -https://readmedium.com/python-data-structures-tuple-c84a3f822ab2
What is DataFrame?
A DataFrame is two-dimensional data structure with labelled axis- rows and columns
It is mutable
can store heterogeneous data type — numbers, characters, boolean etc.
so it can be compared to a table in databases
Components of a DataFrame
A DataFrame consists of Index, Columns and Data.
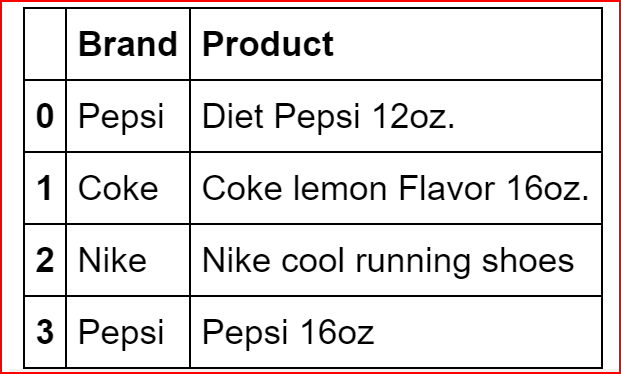
In the above example
Index is the first column with values 0,1, 2, 3. Index is same as row label
Columns are Brand and Product, just like columns in a table
What is use of DataFrame?
Helps with data analysis on small to large data sets as it can be used like a spreadsheet or a tables.
It’s a very powerful data structures that has built in operations that makes data manipulation, data analysis on small or large datasets very easy
Data can be loaded into a DataFrame using different files types — csv, excel, databases, clipboard etc.
In this post we will explore common ways to analyze and manipulate data in a DataFrame used for data analysis,
Creating a DataFrame from a Dictionary, List and ndarray
Selecting, adding, deleting, and renaming columns and rows
Manipulating a DataFrame — Group by, sorting, conditional data search
Iterating through a Data Frame
Pivoting data
Creating a DataFrame from Dictionary
First we need to import pandas library
import pandas as pdNow let’s create a dictionary and then use the dictionary to create a DataFrame
dict1 ={'Brand':['Pepsi','Coke','Nike','Pepsi'],
        'Product':['Diet Pepsi 12oz.', 'Coke lemon Flavor 16oz.', 'Nike cool running shoes', 'Pepsi 16oz']}
productDeatils =pd.DataFrame(dict1)
productDeatils
Creating a DataFrame from List
names =[['Jack',12],['John', 24],['Jill',30], ['Anny',5]]
names_frame = pd.DataFrame(names)
names_frame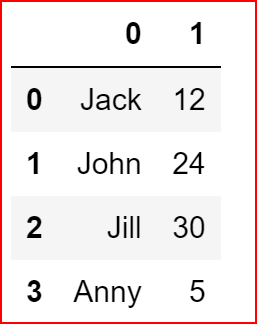
Creating a DataFrame from ndarray(n- dimensional) array.
In the example below, data for the dataframe starts from row 1 till end and col1 till end .
column for dataframe is row 0 of the ndarray and col 1 till end of the ndarray
index for the dataframe starts from row 1 till end and column 0 of the ndarray
import numpy as np
data = np.array([['', 'State', 'Capital'],
                 ['state1', 'Iowa', 'Demoines'],
                 ['state2', 'California', 'Sacramento'],
                 ['state3', 'Ohio','Columbus',],
                 ['state4', 'Alabama', 'Montgomery'],
                 ['state5', 'New York', 'Albany'],
                 ['state6','Florida', 'Tallahassee'],
                 ['state7','Kansas','Topeka']
                ])
state = pd.DataFrame(data= data[1:,1:], columns=data[0,1:], index= data[1:,0])
state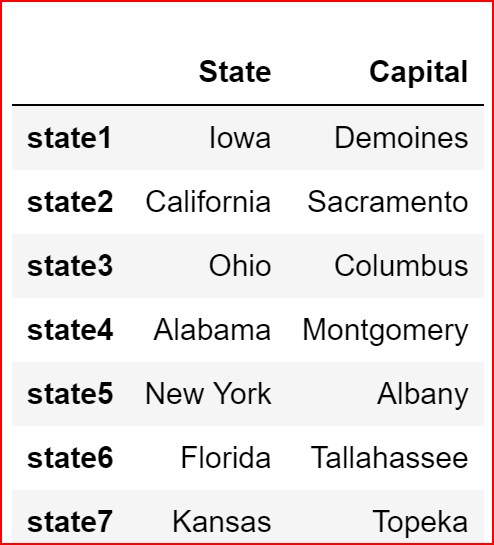
Selecting columns and rows from a DataFrame
First we need to understand the difference between loc and iloc.
iloc is integer based selection — select rows and columns by number
loc method is based on index of the DataFrame(if any).
Let us understand this with an example where we will use state dataframe created earlier. we want to select California, which is row 2 and col 1. Remember in Python Index start at 0 so we want to extract row 1 and col 0.
print(state.iloc[1,0])print(state.loc['state2','State'])California
CaliforniaSelecting a range of values
In the example below, we have selected rows 3 to row 5(remember index starts at 0 in python and the last index is always left out)
state.iloc[2:5]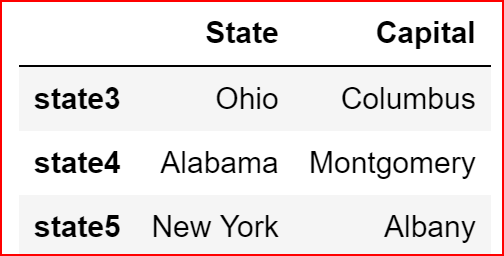
Selecting rows and columns in a DataFrame
state.iloc[1:3, 1]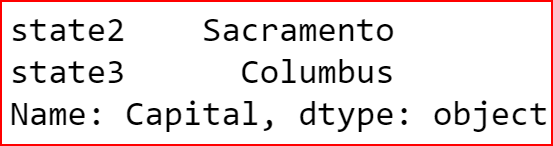
Adding a column to an existing DataFrame
we can create a list of values that match length of index else it will give a ValueError.
Here we are adding a sales column to the existing dataframe productDeatils
Sales_in_million =[1, 1.5, 2,6]
productDeatils['Sales'] = Sales_in_million
productDeatils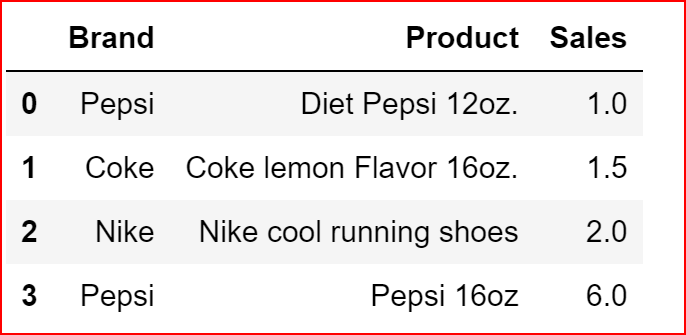
Adding a row to DataFrame
we will create a dataframe and then use append() to append the contents of one dataframe to another. No. of columns should match between the two dataframe
df_row = pd.DataFrame([['Disney',' Frozen Princess Alsa', 3],
                       ['Apple', 'Iphone7', 50]],
                      columns=['Brand','Product','Sales'])
productDeatils = productDeatils.append(df_row)
productDeatils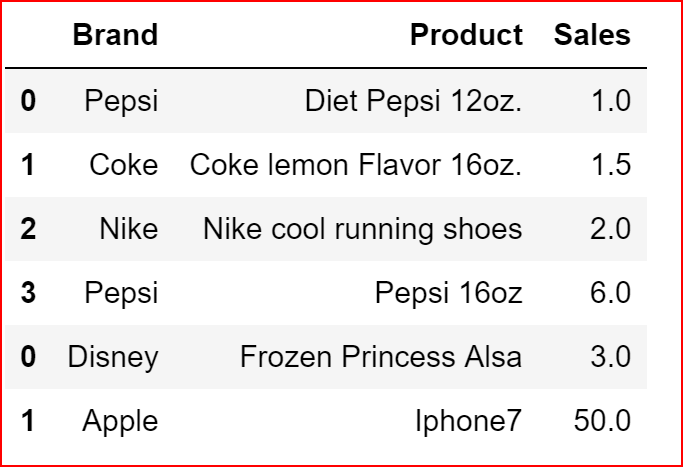
Deleting a column from a DataFrame
To delete a column we can use del, drop or pop methods.
In del(), we specify the column name to be removed
In drop(), we specify the column name or the index name to be dropped, axis=0 refers to row and axis=1 refers to column, inplace is set to false by default.
Inplace = True drops the column from the DataFrame without re-assigning back to dataframe
pop(), we specify the column name to be removed
del productDeatils['Brand']
productDeatils.drop('Sales',axis=1, inplace =True)
productDeatils.pop('Product')
output will be empty as we have dropped all columns
Deleting a row from a DataFrame
we will use drop() to delete a row from a DataFrame, This is similar to using drop on a column
data_1 = {'Name':['Amy', ' Anu', ' David', 'Tom'],
         'Reports':[12,3,14,12],
         'Hobby':['Reading', 'Singing', 'Travelling', ' Technology']}
hobby = pd.DataFrame(data_1, index =['Person1', 'Person2', 'Person3', 'Person4'])
hobby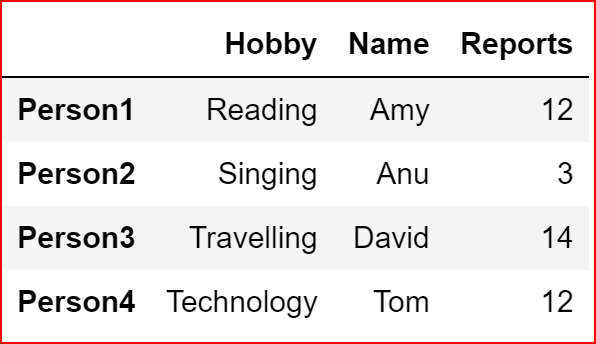
Now we will delete Person2 row.
If we don’t reassign and use inplace =False then the data would still remain the DataFrame
hobby.drop(["Person2"], axis=0, inplace=False)
hobbyHere we will reassign the data back to hobby along with inplace = False.
hobby = hobby.drop(["Person2"], axis=0, inplace=False)
hobby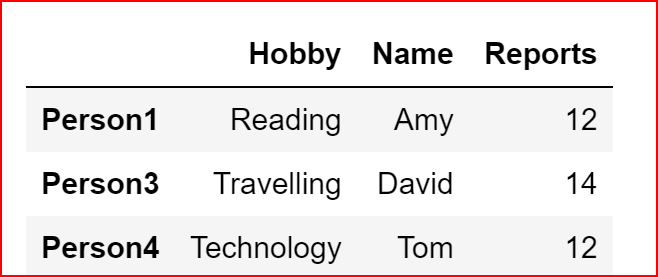
Renaming a column in a DataFrame
Here we are renaming columns 0 to Name and column 1 to Age. earlier we had the dataframe as shown below
names_frame.rename(columns={0:'Name', 1:'Age'}, inplace=True)
names_frame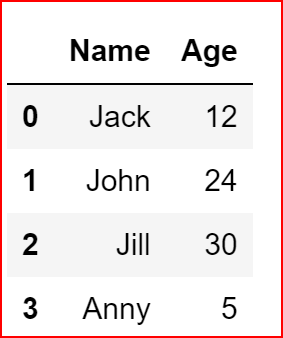
Renaming the Index in a DataFrame
We have renamed the Index 0 to ‘Jack Details’
names_frame.rename(index={0:'Jack Details'}, inplace=True)
names_frame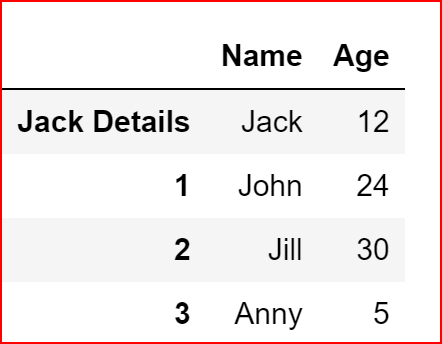
Grouping the DataFrame
when grouping data we can specify the column by which need to group the data and then use any of the aggregate functions
grp_data = productDeatils.groupby('Brand').count()
grp_data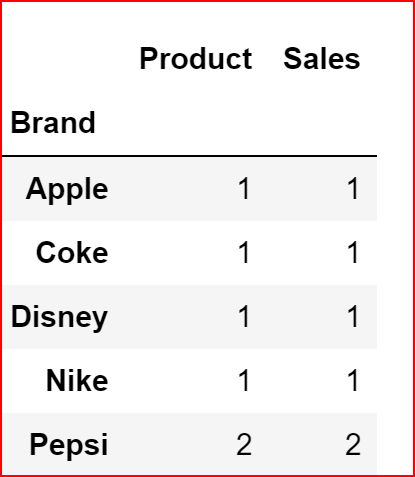
grp_sales = productDeatils.groupby('Brand').sum()
grp_sales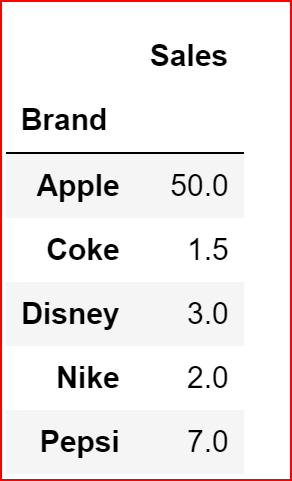
Sorting data in DataFrame
we use sort_values(0 to sort the data by specifying the column name and optionally we can specify the sort order. By default sort order is ascending
productDeatils.sort_values('Product')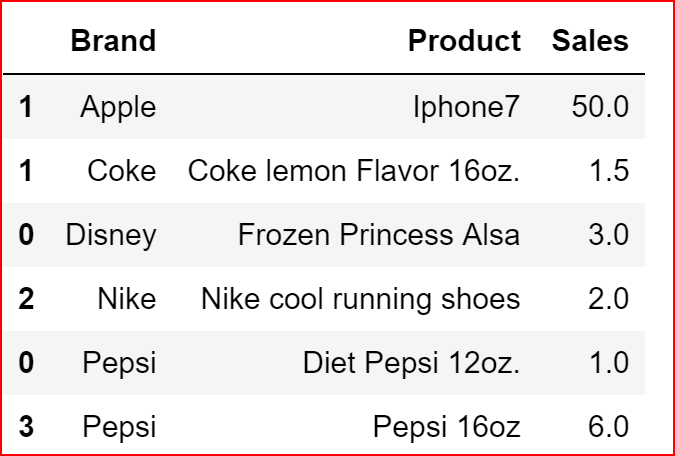
productDeatils.sort_values(['Sales','Brand'], ascending=False)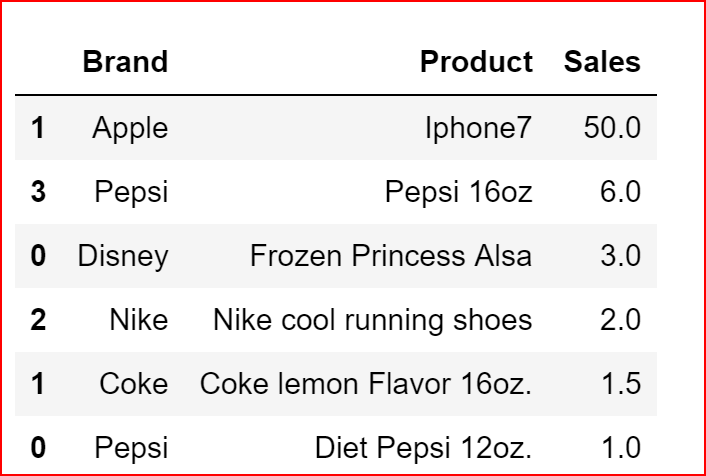
Conditional Search for data in a DataFrame
sales_more_2M= productDeatils[productDeatils.Sales > 2]
sales_more_2M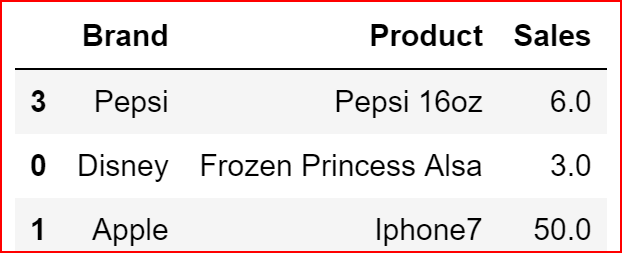
we can search based on multiple conditions. For multiple conditions we can use “&” for and and “|” for or condition
pepsi_sales_more_2M= productDeatils[(productDeatils.Sales > 2) &
                                    (productDeatils.Brand == 'Pepsi')]
pepsi_sales_more_2M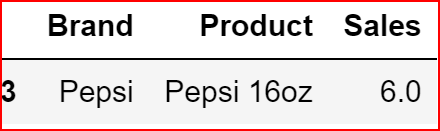
Iterating through a DataFrame
To iterate through the DataFrame, we can use
iteritems() : to iterate over row (key,value) pairs
iterrows(): iterate over rows as (index, series) pairs
itertuples() : iterate over rows as namedtuples
brand_product = productDeatils.iloc[:,:2]
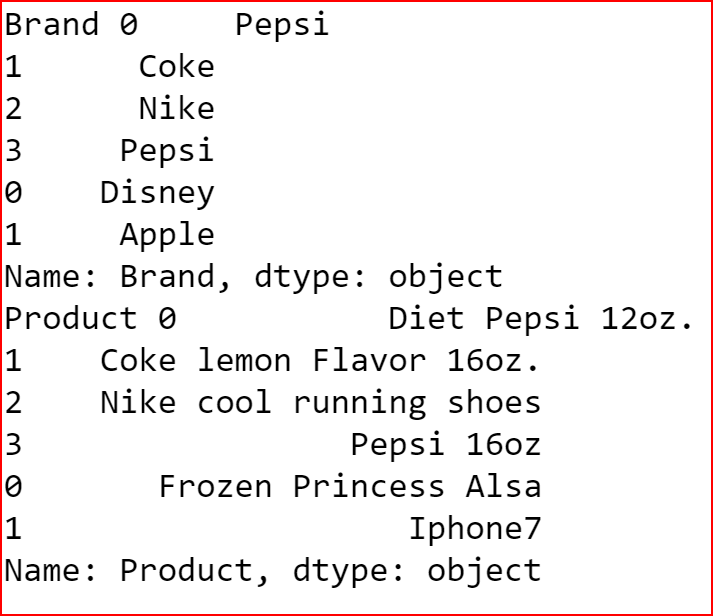
for key,value in brand_product.iteritems():
print( key, value)Below we use iteritems() where each column is iterated as a key value pair. First, we have Brands as key value pair and the Product as key value pair
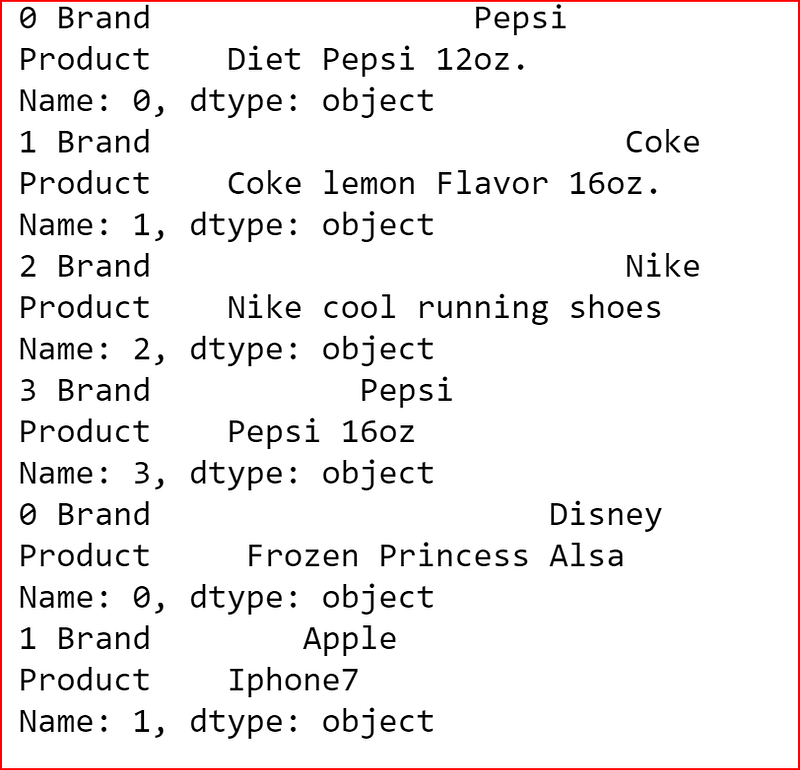
for index, row in brand_product.iterrows():
 print(index, row)
In iterrows() returns a Series for each row and does not preserve the datatype across the rows
for row in brand_product.itertuples():
    print(row)
itertuples() iterate over dataframe as rows with Index as the first element of the tuple

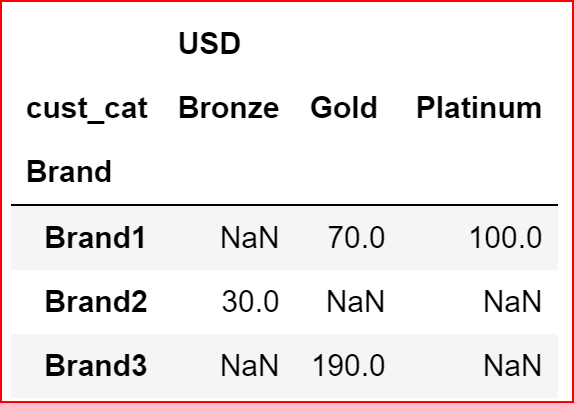
Pivoting data
This is just an introduction to pivoting data.
To pivot the data we need to provide index, columns, values. index and columns are mandatory arguments
data={"Brand": ['Brand1', 'Brand2', 'Brand1', 'Brand3'],
     "cust_cat":['Platinum', 'Bronze', 'Gold', 'Gold'],
     'USD': [100, 30, 70, 190]}
df1 = pd.DataFrame(data)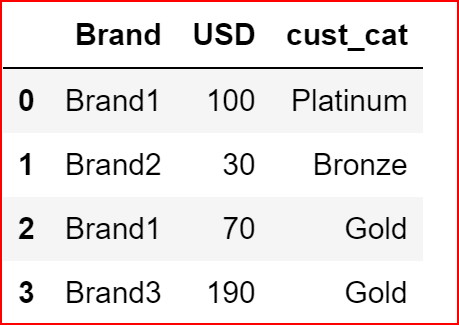
df1.pivot(index ='Brand', columns="cust_cat")Here we have pivoted the Data on Brand by setting index to Brand and Columns are the distinct values for cust_cat