
The Truth About PSLF.
(Hint: The numbers show fantastic news.)

Introduction
The naysayers will spout the refrain that PSLF is a government program run amok.
Too much paperwork and too little forgiveness!
I call bullshit.
All the hand wringing about the program is noise. We need to find the signal.
Let me show you the truth about the PSLF program.
PSLF Basics
I wrote a full article on the basic requirements of the PSLF program, but here they are in a nutshell.
If you work full-time (>30 hours/week)
- for a qualifying employer (government or non-profit) and
- make enough qualifying payments (120)
- on your qualifying loans (Direct Loans)
- via a qualifying payment plan (Income-Driven Repayment, or IDR plan)
then you will receive full forgiveness on those student loans.
Unfortunately, the Department of Education screwed the pooch when they rolled out the program in 2007. NPR sums it up best.
Here’s the problem.
The first several years this program was in effect, the Ed Department and loan companies — they really did a terrible job of managing it and of explaining it to people.
So borrowers were often given no advice, or sometimes they were given wrong advice to the point that, in recent years now, we’re seeing thousands of borrowers come out of the woodwork and say, wait; I thought I was on track.
And instead, they realize they don’t even qualify for loan forgiveness.
The DOE didn’t get around to fixing the biggest mistakes until 2011. These problems essentially made everyone who started working toward forgiveness prior to 2012 a lab rat in a government experiment.
However, those fixes were made nine years ago, and the communication from both DOE and FedLoan Servicing (the only approved loan servicer for PSLF borrowers) has increased substantially.
Improvement in these areas is already starting to be seen if we delve deeper into the data.
The (Dreadful) Numbers
Okay, let’s start off with the biggie.
As of the April 2020 PSLF report, there have been 180,798 PSLF applications received and processed by the Department of Education, with only 3,376 being approved.
Total approval rate: 1.87%
That’s the headline number that most everyone will use when writing an article about PSLF. And I’ll be the first to admit that sounds abysmal, but are things really that bad?
Here is the history of the total PSLF approval rate since the first applicants were granted forgiveness.
(Note: Prior to January 2020, PSLF data only came quarterly.)
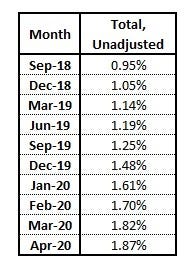
1.87% is nothing to be excited about, but it is almost double the rate of 0.95% when the program first started.
Here is the data in chart format to better illustrate the trend.
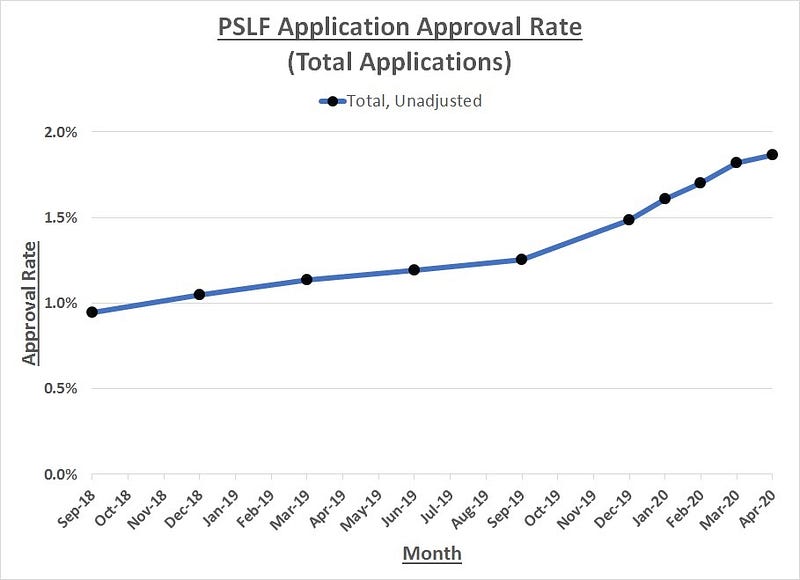
Better, but not good.
But again, are the numbers really that bad?
Sifting Through the Data
If you take a deeper dive into the report, you’ll see that there are three main explanations for why a PSLF application is rejected. I also added the numbers from the April 2020 report.
- Qualifying payments (58%; or 104,863)
- Missing information (23%; or 41,584)
- No eligible loans (14%; or 25,312)
When looking at the definitions of these categories, we quickly realize that some can be easily thrown out of our data pool.
Let’s take a look.
Qualifying Payments
The borrower submitted a completed application and was reviewed to determine if the payments made qualify based on the criteria for the program (on-time, in full, on a qualifying repayment plan, while working at a qualifying employer).
The results show the borrower has not made 120 qualifying payments.
The borrower is informed they do not qualify because they have not yet made enough qualifying payments.
The borrower is instructed to continue making qualifying payments and to resubmit the forgiveness application once 120 payments have been made.
This is a big category, as you can be ineligible for a qualified payments for,
- Not making the total number of payments
- Making the payments, but not while employed at a qualified employer
- Making the payments, but not while on a qualified repayment plan
- Making the payments, but not on a qualified loan
With all of these variations, we can’t discount this category as merely a mistake in the process.
Verdict: Keep these applications.
Missing Information
The application for forgiveness submitted was incomplete or didn’t have all the required information necessary to process the application.
In this case the borrower is notified of what information is missing and requested to submit the missing information.
Once the required information is resubmitted, the application is reviewed again to determine if the borrower now qualifies for forgiveness.
This category simply rejects those applications that are incomplete.
And we can reject them as well.
Why?
Because submitting an application for loan forgiveness that doesn’t have all the information, then reporting it as an outright “rejection” is completely misleading.
This wasn’t the fault of either DOE or FedLoan. The borrower merely sent incomplete paperwork.
Verdict: Subtract these applications.
No Eligible Loans
The borrower has requested forgiveness but the borrower does not have Direct Loans that are eligible to participate in the PSLF program.
Typically these borrowers have FFEL, Perkins or private/non-federal loans.
The borrower is informed they do not have loans eligible for PSLF and informed that FFEL or Perkins loans could be consolidated into DL, BUT they would then need to make 120 qualifying payments on the new consolidation loan (no previous payments on the FFEL or Perkins loans would count).
This is a bitch of a category to decide whether or not to keep.
On the one hand, borrowers have relayed myriad stories of being told that their loans were eligible, only to find out that information was incorrect when their applications rejected.
On the other hand, Direct Loans have been around for a decade, and that should be plenty of time to make sure you have the right type of loans.
I made the decision to not include these applications in our total, as borrowers should know better than to apply with ineligible loans by now.
Verdict: Subtract these applications.
The New Numbers
So where does this leave us?
We started with 180,798 processed applications. After removing the obviously incorrect applications, we are left with 113,902 rejected applications.
Dividing that into our approved total of 3,376, we get an adjusted approval rate of 2.96% for April 2020.
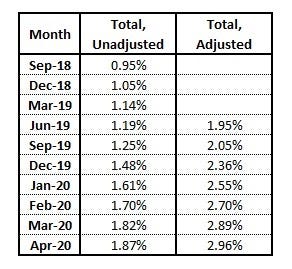
Here is the history table, comparing the adjusted and unadjusted data.
(Note: The data for ineligible PSLF applications was not standardized until June 2019.)
And again the chart, with both data sets.
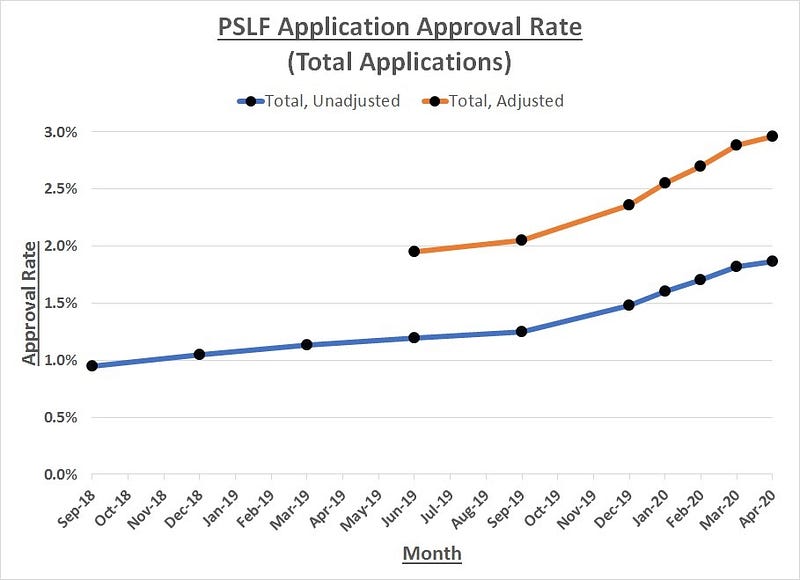
Now we’re getting somewhere, and we’re not even done parsing the data yet.
Monthly Improvement
So far, we have been talking about the total approval rates of the PSLF program. The problem with this is that it shows us so very little of the improvement of the program over time.
So why do people keep writing about it?
Well, two reasons. And they’re both bad.
- It’s easy. (You just need to do one division problem.)
- It sells. (Everyone loves a train wreck.)
But what happens is we look at the incremental data, month-over-month (MoM)?
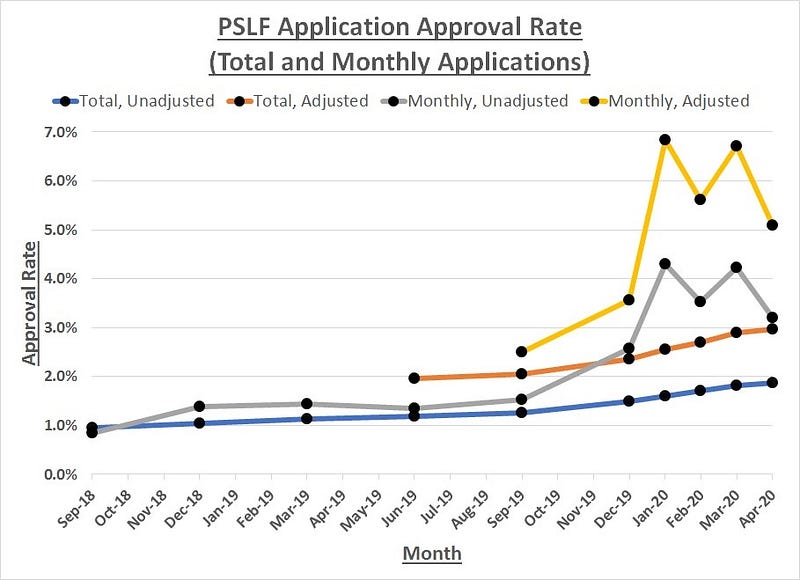
Here are the table and chart of the unadjusted MoM data.
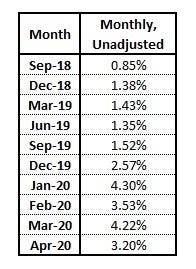
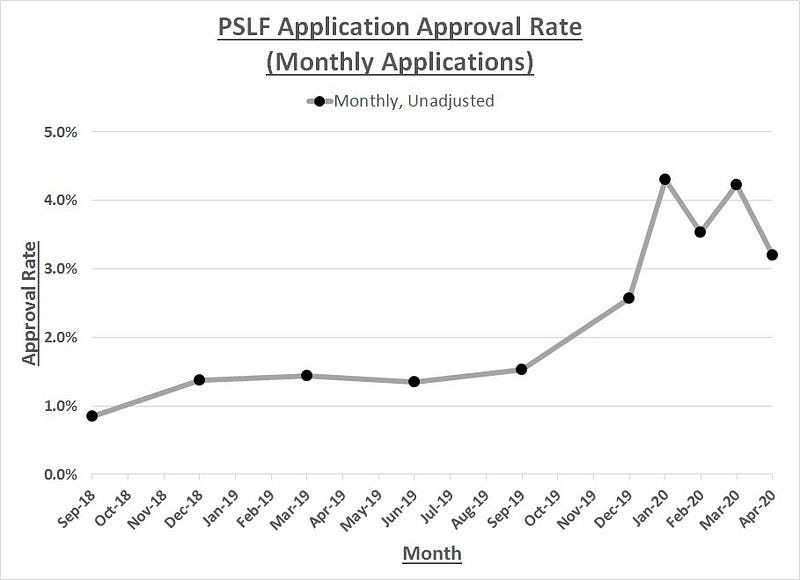
This looks even better than even the adjusted total approvals, with a peak approval rate of 4.30% in January 2020.
I’m sure you know what’s coming by now, but what happens when we apply the filters from earlier to the month-over-month data?
Let’s take a look.
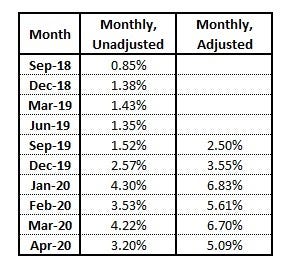
The past four months have all seen the approval rates higher than 5%.
That’s a 500% or higher improvement over the first month of the program, and more than twice as high as the numbers being reported by the major media outlets.
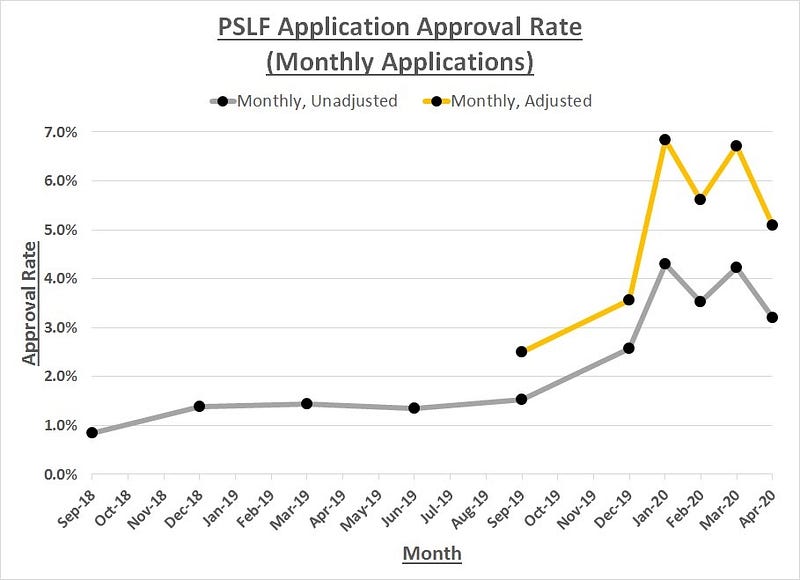
Finally, here is all the data put together in one chart for comparison.
Future of PSLF
I’ll be the first to admit that single-digit approval rates are nothing to brag about.
The point I’m trying to make here is that the PSLF program isn’t completely broken…it just had a disastrous rollout. But it’s getting better.
So what can we look forward to with PSLF?
Only more forgiveness each and every year.
For example, we can see the effect that the introduction of the Income Based Repayment plan is having. IBR was first introduced in October 2009 for the 2010 federal fiscal year. Given the glacial pace that student loan servicers process paperwork, most people applying for IBR did not get on that plan until early 2010.
10 years later, we start seeing a spike in the monthly approval rate.
This is not a coincidence.
Similarly, the Employment Certification Form was not issued until 2011, so we will see another spike in 2021 for those borrowers who verified their employer status early on.
Other issues with the first cohort of borrowers will produce a similar result as they work through the system.
I’m not the only one who thinks this way.
There are
- 2,924,258 approved ECFs out there, representing
- 1,312,350 unique borrowers with a total of
- $115,312,942,982 in outstanding balances.
That last number is $115 billion. With a B!
And these are just the people who have submitted the paperwork. How many are out there working in qualified jobs who are just getting started or haven’t sent in any forms yet.
My guess is way more than you or I, or the government, realizes. And those people are going to have a few demands.
- The federal government keeps the program (with possible adjustments to the all-or-nothing approach).
- FedLoan Servicing provides customer service that has been severely lacking.
- Paperwork turnaround times are shortened substantially.
In short, the PSLF program is a monster, but it will only get better as time goes on.
Related Articles/Resources
- PSLF Update — July 2020
- The Basics of Public Service Loan Forgiveness
- Is PLSF Right for Me?
- In Defense of Public Service Loan Forgiveness
- How to Hack the Secretly Successful PSLF Program
If you are interested in actionable, up-to-date info about personal finance, click here to join my e-mail list.
This article is for informational purposes only and should not be considered Financial or Legal Advice. Not all information may be accurate. Consult a financial professional before making any major financial decisions.


