
Prometheus vs. ELK Stack: Unraveling the Battle of Monitoring and Logging
The differences between Prometheus and ELK Stack, their strengths, weaknesses, and ideal scenarios for implementation.
Introduction
In the world of software development and operations, monitoring and logging play a crucial role in ensuring system reliability, identifying issues, and optimizing performance. Two popular contenders in this realm are Prometheus and the ELK Stack. While both offer powerful capabilities, they have different approaches and features that make them suitable for distinct use cases. In this article, we’ll delve into the Prometheus vs. ELK Stack showdown, exploring their strengths, weaknesses, and ideal scenarios for implementation.

Prometheus: Unleashing the Power of Metrics
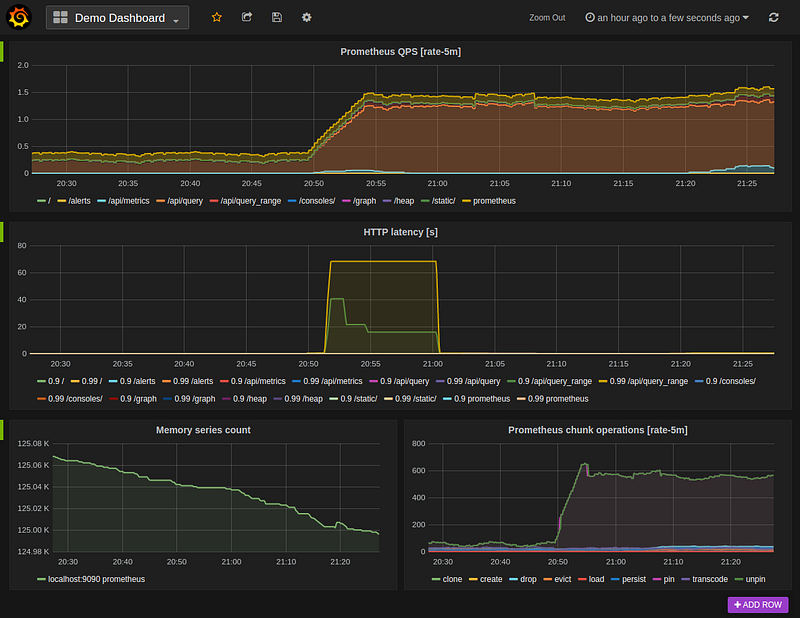
Prometheus, a leading open-source monitoring solution, has gained immense popularity for its focus on time-series data and robust metric-based monitoring. With its flexible query language, PromQL, Prometheus allows you to collect, store, and analyze metrics from a wide range of systems and applications. It excels at monitoring resource utilization, application performance, and overall system health. Its alerting capabilities are highly customizable, ensuring timely notifications when anomalies occur. Prometheus is ideal for environments that demand real-time insights, extensive metric-based monitoring, and efficient alerting mechanisms.
Here are some additional key features and capabilities of Prometheus:
Service Discovery: Prometheus supports various service discovery mechanisms, such as DNS-based, Kubernetes, and file-based service discovery. This allows Prometheus to automatically discover and monitor new targets without manual configuration.
Dynamic Configuration: Prometheus allows dynamic configuration updates, which means you can add or remove targets, change alerting rules, or modify scrape intervals without restarting the Prometheus server.
Metrics Collection and Scraping: Prometheus uses a pull-based model for collecting metrics. It periodically scrapes metrics data from configured targets by making HTTP requests to the target’s metrics endpoint. This approach allows Prometheus to collect metrics from a wide range of systems and applications.
Data Retention and Storage: Prometheus stores metrics data locally in a time-series database with a configurable retention period. It discards old data based on configured retention policies, allowing you to balance storage requirements and historical data analysis.
Highly Scalable and Distributed: Prometheus can be scaled horizontally by deploying multiple instances in a federated setup. Each instance can scrape and collect metrics independently, and the data can be aggregated at a central Prometheus server.
Alerting and Notification: Prometheus comes with a built-in alert manager that allows you to define alert rules based on specific conditions and thresholds. When an alert is triggered, it can send notifications to various channels like email, PagerDuty, or other external systems.
Integration with Grafana: Prometheus can be integrated with Grafana, a popular open-source data visualization and monitoring tool. Grafana provides a more advanced and flexible visualization layer, allowing you to create custom dashboards and visualizations based on Prometheus metrics data.
Rich Ecosystem: Prometheus has a vibrant and growing ecosystem of exporters, which are third-party integrations that allow you to collect metrics from various systems and applications. There is also an extensive library of pre-built dashboards, rules, and alert templates available for common use cases.
Community and Support: Prometheus has an active community of users and contributors, which means there are plenty of resources, documentation, and community support available. The community regularly releases updates, improvements, and bug fixes, ensuring the ongoing development and support of the tool.
These features make Prometheus a popular and powerful monitoring and alerting solution, widely used for infrastructure and application monitoring in cloud-native environments. It provides flexibility, scalability, and robust metrics collection, enabling you to gain insights and observability into your systems and applications.
ELK Stack: Exploring the Depths of Logs
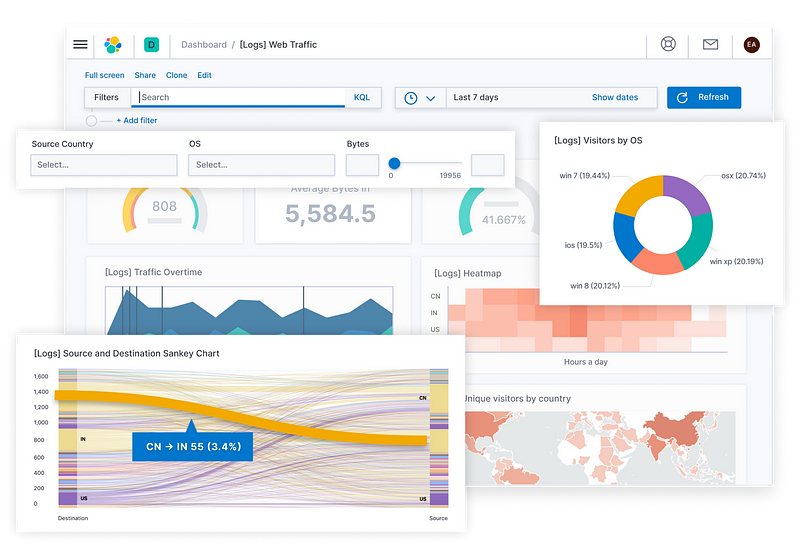
The ELK Stack, comprising Elasticsearch, Logstash, and Kibana, is renowned for its proficiency in log management and analysis. Elasticsearch serves as the distributed search and analytics engine, Logstash acts as the data processing pipeline, and Kibana offers the visualization and dashboarding component. This stack excels at collecting, indexing, and searching logs from various sources, enabling detailed analysis and troubleshooting. Its strength lies in its ability to handle vast amounts of log data, providing valuable insights into system behavior, errors, and security issues. The ELK Stack is well-suited for environments that prioritize log analysis, centralized logging, and powerful search capabilities.
Here are some additional key features and capabilities of the Elasticsearch stack:
Scalability: Elasticsearch is designed to scale horizontally, allowing you to distribute data across multiple nodes in a cluster. This enables you to handle large amounts of data and accommodate high traffic loads.
Near Real-Time Indexing and Searching: Elasticsearch provides near real-time indexing, which means that as soon as data is indexed, it becomes searchable. This allows for quick retrieval and analysis of data, making it suitable for applications that require fast and efficient search capabilities.
Schemaless and JSON-based: Elasticsearch is schemaless, meaning that you don’t need to define a rigid structure for your data before indexing it. It can handle and index JSON documents directly, making it flexible and adaptable to different data formats.
High Availability and Fault Tolerance: Elasticsearch employs a distributed architecture that ensures high availability and fault tolerance. It uses replication and shard allocation to distribute data across nodes, allowing for automatic failover and data redundancy.
Aggregation and Analytics: Elasticsearch provides powerful aggregation capabilities that allow you to summarize, group, and perform calculations on your data. Aggregations can be used to generate reports, perform analytics, and gain insights from your data.
Multi-Tenancy and Security: Elasticsearch supports multi-tenancy, allowing you to create isolated environments for different applications or users within the same cluster. It also provides various security features, such as authentication, role-based access control, and transport encryption, to ensure the confidentiality and integrity of your data.
Plugins and Integrations: Elasticsearch offers a wide range of plugins and integrations with other tools and frameworks. These plugins extend Elasticsearch’s functionality and enable integration with popular data processing, visualization, and monitoring tools.
Machine Learning: Elasticsearch has built-in machine learning capabilities through its Machine Learning plugin. This allows you to detect anomalies, predict future behavior, and automate decision-making based on patterns and trends in your data.
These features make the Elasticsearch stack a versatile and powerful tool for a variety of use cases, including log management, search applications, real-time analytics, monitoring, and more.
Prometheus and ELK Stack: Key Differences and Complementary Roles
While Prometheus and the ELK Stack address different aspects of monitoring and logging, they can also complement each other in certain scenarios. Prometheus focuses on real-time metrics, providing valuable insights into system performance and resource usage, whereas the ELK Stack excels at log analysis, enabling deep dives into historical data and facilitating forensic investigations. Integrating the two can create a comprehensive monitoring and logging solution, where Prometheus monitors key metrics while the ELK Stack analyzes logs for troubleshooting and long-term analysis.
Here’s a broader comparison between Prometheus and Elasticsearch:
Architecture and Data Collection: Prometheus follows a pull-based model where it scrapes metrics from targets over HTTP. It collects and stores time-series metrics data in its local storage. On the other hand, Elasticsearch follows a distributed architecture and primarily focuses on log collection and analysis. It can ingest data from various sources, including logs, metrics, and other forms of structured or unstructured data.
Data Model: Prometheus has a multi-dimensional data model that allows you to store metrics with labels, enabling rich contextual monitoring. It primarily focuses on numeric metrics. Elasticsearch, on the other hand, is a NoSQL document-oriented database that can store and index different types of data, including logs, metrics, and other structured or unstructured data.
Querying and Visualization: Prometheus provides its own query language called PromQL, which is specifically designed for time-series data. It offers a basic visualization interface but is often combined with Grafana for more advanced and customizable visualizations. Elasticsearch uses a query language based on JSON and provides powerful search and aggregation capabilities. It is typically used with Kibana, a dedicated data visualization tool that is tightly integrated with Elasticsearch.
Monitoring Use Cases: Prometheus is primarily focused on metrics monitoring and alerting. It is commonly used for monitoring applications and infrastructure metrics. Elasticsearch, on the other hand, is widely used for log management, search, and analytics. It can handle a wide range of use cases, including log analysis, security monitoring, business analytics, and more.
Ease of Use: Prometheus is relatively easy to set up and get started with, with a straightforward configuration and deployment process. Elasticsearch, on the other hand, can be more complex to configure and manage, especially when deploying the entire ELK stack. It requires additional components like Logstash and Kibana to be set up and integrated.
Community and Ecosystem: Prometheus has a thriving open-source community with active development and a wide range of exporters and integrations available. It is part of the Cloud Native Computing Foundation (CNCF) and has a large and growing ecosystem of tools and libraries. Elasticsearch also has a strong community and a rich ecosystem of plugins and integrations. However, with the change in licensing, there has been some impact on the community dynamics and the availability of managed services.
Licensing: Prometheus is released under the Apache 2.0 license and is completely open-source. Elasticsearch, while still open-source, has changed its licensing to a dual-license model (Elastic License and Server Side Public License — SSPL). This change restricts cloud providers from offering managed Elasticsearch services, which may impact the availability of certain services and vendor support.
Ultimately, the choice between Prometheus and Elasticsearch depends on your specific use case, monitoring requirements, and preferences. Prometheus is well-suited for metrics monitoring and alerting, while Elasticsearch excels in log management, search, and analytics.
Choosing the Right Solution for Your Needs
To determine whether Prometheus or the ELK Stack is the best fit for your requirements, consider the following factors:
Monitoring goals: If your primary focus is on real-time metric-based monitoring, Prometheus should be your choice. If you need to deep dive into logs for analysis, troubleshooting, or security audits, the ELK Stack is more appropriate. Data volume: Prometheus is optimized for high-frequency metric collection, while the ELK Stack handles large volumes of log data efficiently. Alerting and visualization: Prometheus offers a built-in alerting system and basic visualization capabilities. In contrast, the ELK Stack, with Kibana as its visual component, provides robust visualization options and flexible alerting mechanisms. Ecosystem and community support: Both Prometheus and the ELK Stack have active communities and a rich ecosystem of plugins, integrations, and extensions. Consider the available resources and community support when making your decision.
Conclusion
In the Prometheus vs. ELK Stack battle, there is no clear winner, as both solutions excel in their respective domains. Prometheus shines in real-time metric-based monitoring, while the ELK Stack empowers log analysis and search capabilities. Depending on your monitoring and logging needs, you can choose one or integrate both to create a comprehensive solution. Understanding the strengths, weaknesses, and ideal use cases of each will be immensely beneficial.


