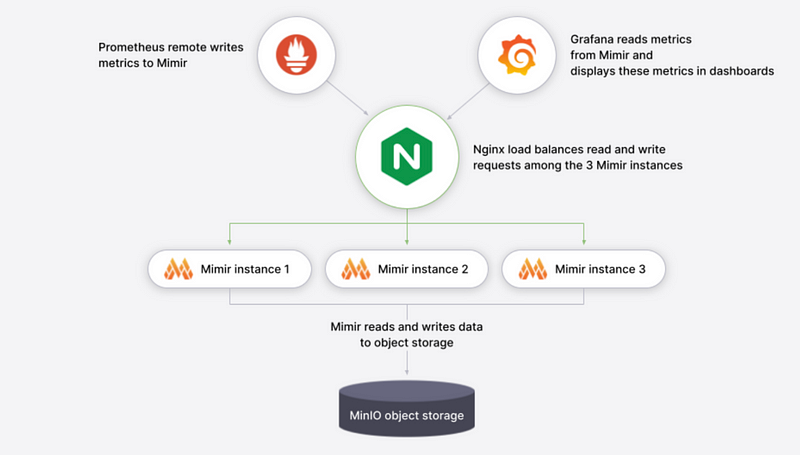
Prometheus remote write to Grafana Mimir, Long term storage for Prometheus data

Prometheus is a well-liked open-source monitoring and alerting tool that is frequently employed for gathering and analyzing metrics from diverse sources. To find and fix problems in real time, it includes strong querying and alerting capabilities. A cloud-based metrics platform called Grafana Mimir, on the other hand, gives customers access to a single area where they can store, analyze, and display their metrics data. In order to take advantage of the sophisticated functionality provided by both systems, we will go over how to configure Prometheus remote write to Grafana Mimir in this blog article.
Prometheus :
Remote Write Prometheus remote write is a feature that allows Prometheus to send its metrics data to another system for long-term storage and analysis. This feature is particularly useful for organizations that need to store metrics data for extended periods, as Prometheus is primarily designed for real-time monitoring and alerting. By setting up remote write, you can leverage the scalability and flexibility of other systems for long-term storage and analysis.
Grafana Mimir :
A cloud-based metrics platform called Grafana Mimir offers users a single spot to store, analyze, and visualize their metrics data. It is a fully managed service that supports a variety of data sources and offers users strong visualization tools for processing and displaying their metrics data. Additionally, Grafana Mimir has built-in alerting and anomaly detection features that help users keep track of important metrics and react quickly to problems.
Prometheus Remote Write to Grafana Mimir Configuration You must perform these easy steps to configure Prometheus remote write to Grafana Mimir: Step 1: Activate your Grafana Mimir account. Creating a Grafana Mimir account is the first step in configuring remote write to Grafana Mimir. You must create a new data source for Prometheus after creating an account.
Step 2: Setup Prometheus for remote writing. The next step is to set up Prometheus for remote write. You must include the following lines in your Prometheus configuration file to accomplish this:
remote_write:
  - url: "https://mimir.grafana.com/api/prom/push"
    write_relabel_configs:
    - source_labels: [__name__]
      target_label: __name__
      regex: "(.*)"
The URL of the Grafana Mimir API endpoint, which is where Prometheus will deliver its metrics data, is specified in these lines. You can substitute your own instance of Grafana Mimir for the URL. Step 3: Test remote writing, when Prometheus has been configured for remote write, you can test it by launching it and confirming that metrics data is being sent to Grafana Mimir. You may check that the metrics data is being presented by executing a query in Grafana Mimir.
Conclusion:
Using the scalability and flexibility of Grafana Mimir for long-term storage and analysis of their metrics data is made possible by the potent Prometheus remote write to Grafana Mimir functionality. You can quickly set up remote write in Prometheus and begin delivering your metrics data to Grafana Mimir by following the instructions provided in this blog post. By doing so, you will be able to benefit from the sophisticated capabilities that both systems have to offer and keep track of important metrics and problems.


