
Profile Memory Consumption of Python functions in a single line of code
Monitor line-by-line memory usage of functions with memory profiler module

Python is a popular language among the data science community known for its robustness and vast presence of frameworks. Python prefers simplicity over complexity which makes it more popular but compromising the performance. Python programs are often prone to memory management issues.
Data Scientists use Python language to process a vast amount of data on a fixed memory constraint. If the code execution exceeds the RAM limit, one may experience memory errors and the program execution terminates. A quick solution is to increase the memory allocation to avoid memory management issues, but this is not always feasible.
Why Memory Profiling is Important?
Often newbies do not release unused memories and continuously assign new variables, that may increase memory consumption. When the code is been executed, more and more memory is been assigned. Python automatically manages the memory, but it may fail to return the memory consumption to the operating system while executing long Python codes.
So external tools are required to monitor the memory consumption that will further help to optimize the memory.
This article will discuss the memory profiler module that monitors the memory consumption of the Python functions.
Memory Profiler:
Memory Profiler is an open-source Python module that uses psutil module internally, to monitor the memory consumption of Python functions. It performs a line-by-line memory consumption analysis of the function.
Installation:
Memory Profiler can be installed from PyPl using:
pip install -U memory_profilerand can be imported using
from memory_profiler import profileUsage:
After everything is set up, it's pretty easy to use this module to track the memory consumption of the function. @profile decorator can be used before every function that needs to be tracked. This will track the memory consumption line-by-line in the same way as of line-profiler.
After decorating all the functions with @profile execute the python script with a specific set of arguments.
Execute the above Python script using bypassing -m memory profiler to the Python interpreter. This will load the memory_profiler module and print the memory consumption line-by-line.
Use the below to execute the Python script along with the memory profiler.
python -m memory_profiler <filename>.py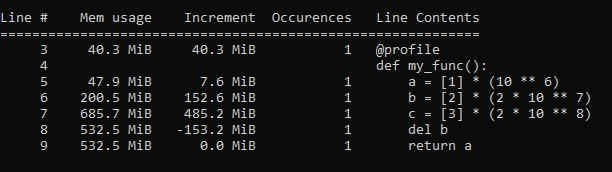
After successful execution, you will get a line-by-line memory consumption report, similar to the above image. The report has 5 columns:
- Line #: Line Number
- Line Contents: Python code at each line number
- Mem usage: Memory usage by the Python interpreter after every execution of the line.
- Increment: Difference in memory consumption from the current line to the last line. It basically denotes the memory consumed by a particular line of Python code.
- Occurrences: Number of times a particular line of code is executed.
Mem Usage can be tracked to observe the total memory occupancy by the Python interpreter, whereas the Increment column can be observed to see the memory consumption for a particular line of code. By observing the memory usage one can optimize the memory consumption to develop a production-ready code.
Conclusion:
Optimizing the memory consumption is as important as optimizing the time complexity of the Python code. By optimizing the memory consumption, one can speed up the execution to some extent and avoid memory crashes.
One can also try custom @profile decorators to specify the precision of the argument. Read the documentation of the memory profiler module for better understanding.
References:
[1] Memory Profiler Documentation: https://pypi.org/project/memory-profiler/
Loved the article? Become a Medium member to continue learning without limits. I’ll receive a small portion of your membership fee if you use the following link, with no extra cost to you.
Thank You for Reading