
FRESH DATA
Prices’ analysis of the best-selling items on Amazon.it in October 2020
Offers’ prices and offer charts for the best-selling products on Amazon.it in October 2020
Amazon is one of the e-commerce platforms with the largest number of users in the world. By analyzing the data of the offers on Amazon.it, we can understand the online shopping habits of Italians.
You can use the data below to fine-tune the prices of the offers on your e-commerce.
Reported below, the analysis of the prices of Amazon.it offers for the best selling items during October 2020.
The data relates to six categories: electronics, clothing, kitchen, bags, shoes, watches.
The study is related to the items that you can find here

Amazon.it offers’ charts of October 2020, considering all categories
The two histograms shown below represent the number of offers for price ranges from 10 to 250 euros:
- On the x-axis: price ranges in euros (0–10, 10–20, 20–30, etc.)
- On the y-axis: number of offers
Click here to see the interactive chart: for each column of the histogram, you will see the price range and the exact number of offers. If you are using your smartphone, you should use the horizontal view.
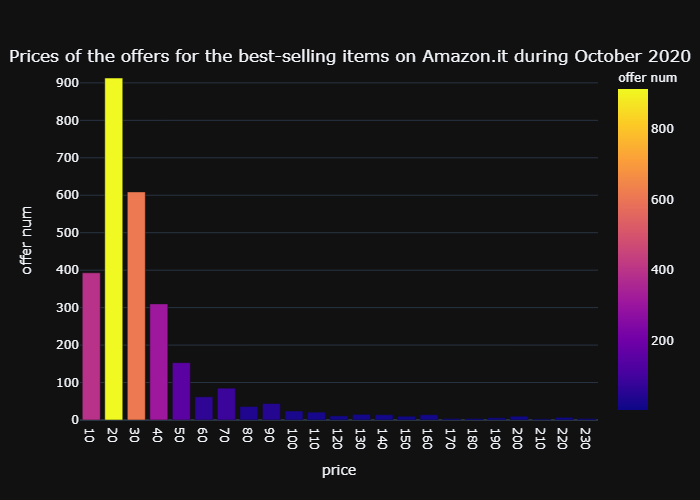
You can immediately see that the most successful offers are those in the price range between 10 and 20 euros.
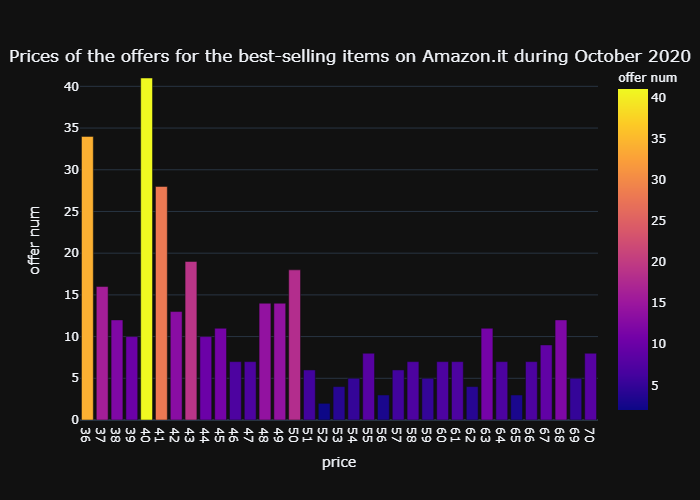
The histograms below show the prices detail in increments of 1 euro. The offers of 20 euros are always more, but you can note that there are many offers of 14 and 15 euros as well.
Click here to see the interactive chart
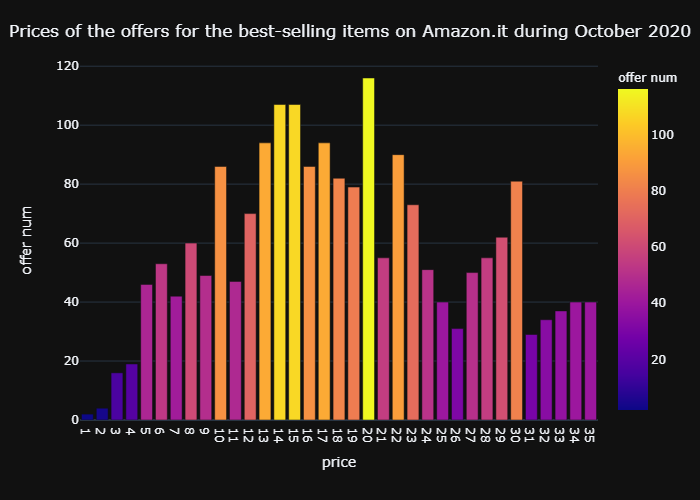
Be careful to the scale of the y-axis, in the first histogram the maximum scale is 100 while in the second histogram it is 40, so be careful to compare the height of the bars of the first graph with those of the second. The offers in the second chart are on average less than the ones in the first chart.
Click here to see the interactive chart
Price comparison between different categories
In the figure below there is the number of offers of the best-selling products for each category, grouped in price ranges of 10 euros (0–10,10–20,20–30, etc.)
Click here to see the interactive chart
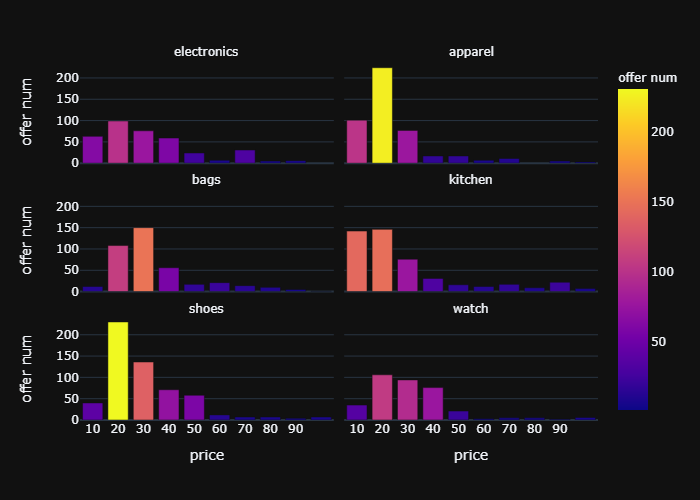
You can see that the offers in the price range from 10 to 20 euros are the most numerous for apparel and shoes.
Bags are the only category where offers in the price range from 20 to 30 euros prevail.
For kitchen items, offers from 0 to 10 euros are 142, almost in equal number compared to those from 10 to 20 euros which are 146.
For watches and electronics, the offers in the range from 10 to 20 euros are more, although the difference with the bands up to 40 euros is less marked.
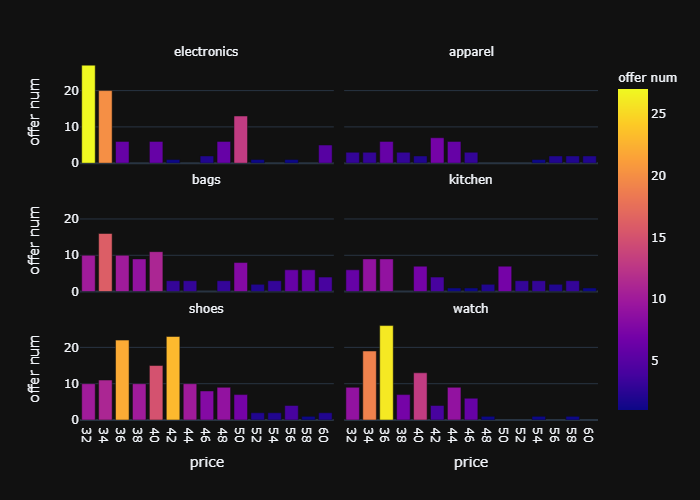
Below are the histograms with details of the prices of the offers divided by category, arranged in price ranges of 2 euros (0–2, 2–4, 4–6, etc.)
Click here to see the interactive chart
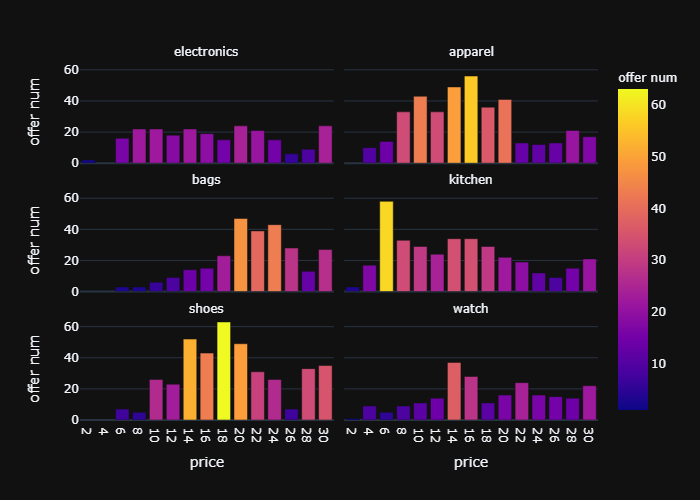
Again, pay attention to the scale of the y-axis, the maximum is 60 for the first graph, while it reaches 25 in the second.
Click here to see the interactive chart
The price ranges with the most offers for each category are:
- Clothing: 16–18 euros with 56 offers
- Watches: 14–16 euros with 37, 16–18 euros with 28 offers
- Bags: 20–22 euros with 47, 24–26 euros with 43 offers
- Kitchen: 6–8 euros with 58 offers
- Shoes: 18–20 euros with 63 offers
- Electronics: 30–32 euros with 27, electronics is the only category to have the most offers in the second graph
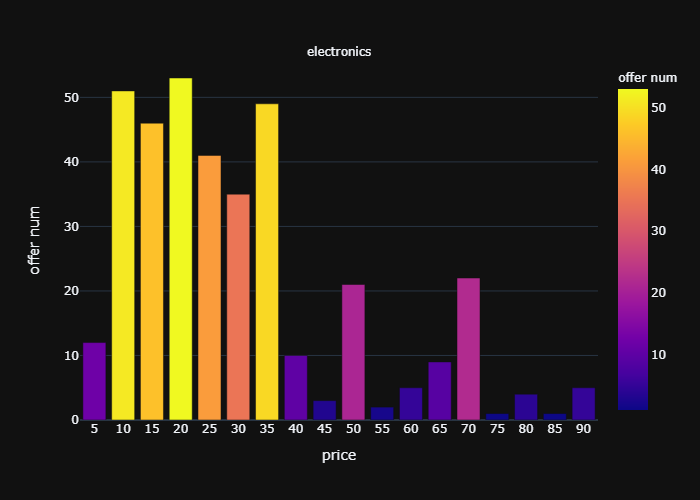
Price analysis for offers in the Electronics category
Since in the electronics there is not a bar that clearly predominates over the others, let’s try to change the price increases and see what happens. Varying price increases from 2 to 5 euros (0–5, 5–10, 10–15, etc.), you can note that the largest number of offers is concentrated in the price ranges from 10 to 35 euros, with 53 offers in the range from 15 to 20 euros.
Click here to see the interactive chart
I hope that the information and data reported above will be useful for your business and will help you to improve your price strategy to get more customers and sales.
Thanks for reading and See you soon 😊