
Predicting the Unpredictable: An Introduction to the Poisson Distribution
An overview of one of the most famous probability distributions

Background
The Poisson distribution is a ubiquitous discrete probability distribution. It was published by Siméon Denis Poisson in the early 19th century and since found applications in many industries, including insurance, epidemiology, and e-commerce. Therefore, it is an essential concept of Data Scientists to be aware of. In this post, we will dive into the intricacies of the distribution and provide real world examples.
Intuition
The core concept of the Poisson distribution is to quantify the probability of an event happening a specific number of times within a given time interval.
As an example, let’s consider a retail shop that receives 20 customers per hour on average. Using the Poisson distribution, we can calculate the probability of the shop receiving a specific number of customers within an hour, such as 10, 15, or 30.
Theory
The probability mass function (PMF) for the Poisson distribution is:

Where:
- e: Euler’s number (~ 2.73)
- k: Number of occurrences (≥ 0)
- X: Discrete random variable (≥ 0)
- λ: Expected number of occurrences (≥ 0)
The Poisson distribution is parametrised by λ, which is the mean of the number of occurrences, E(X) = λ, and the variance, VAR(X) = λ, of the distribution. See here for a derivation of the mean and variance.
It is worth noting that the Poisson distribution is actually derived from the Binomial distribution. Although we will not delve into the derivation in this article, the interested reader can find it here.
The conditions for the Poisson distribution:
- The number of events, k, occur independently (Poisson process)
- The events occur randomly within the time interval
- The expected number of events is fixed
- The probability of getting an event at any point in the time interval is equal
Examples & Plots
Returning to our previous shop example, where the mea number of customers per hour is 20. What would be the probability of the shop receiving 10 customers in one hour?
So, what we have is:
- λ = 20
- k = 10
And, inputting these values into the PMF formula:

As we can see, it is very low. To gain a better intuition of the distribution of customer visits, we can plot the entire PMF:
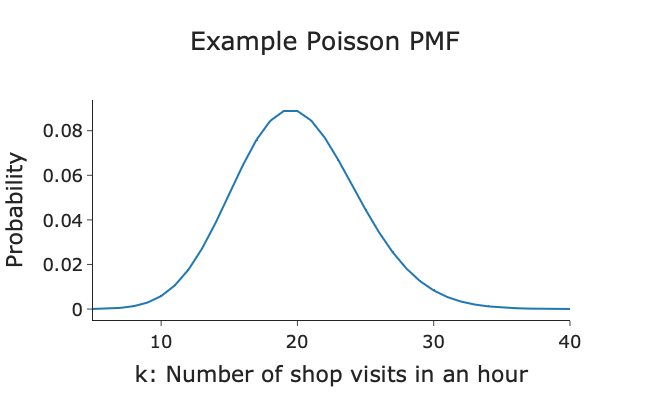
As observed, the distribution of customer visits follows an almost bell curve shape, with the most likely number of customers being 20. This makes as 20 is the expected number. For further insight, let’s explore some scenarios where the mean number of customer visitors is 10 or 30 and plot the corresponding distributions:
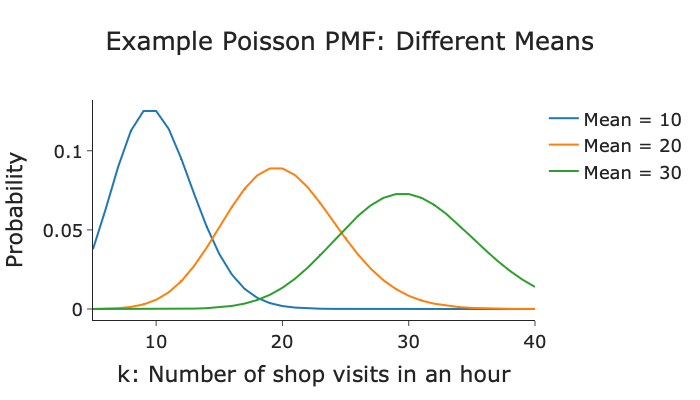
So, when the mean gets smaller, the majority of the probability mass in the distribution shifts towards the left. This shift is expected because the mean rate represents the expected rate of customer visits. Therefore, it is more likely for the number of visitors to be around the mean value.
Summary & Further Thoughts
The Poisson distribution is a widely used and famous probability distribution in Data Science and Statistics. It models the probability of events occurring at a specific rate, based on a given mean rate. The Poisson distribution finds applications in various industries, including genetics, insurance, and fraud detection, among others.
If you would like to view the full code used in this blog, it is available on my GitHub here:
Another Thing!
I have a free newsletter, Dishing the Data, where I share weekly tips for becoming a better Data Scientist, and the latest AI news to keep you in the loop. There is no “fluff” or “clickbait”, just pure actionable insights from a practicing Data Scientist.
References and Further Reading
- Some more examples of Poisson distribution: https://brilliant.org/wiki/poisson-distribution/
Connect With Me!
(All emojis designed by OpenMoji — the open-source emoji and icon project. License: CC BY-SA 4.0)


