
Predicting the Premier League with Random Forest.

The premier league is extremely hard to predict other than predicting Manchester City to win the premier league, but that can not be classed as a good prediction considering how strong they’ve been for the past 8 years or so!
But what if we could use a machine learning algorithm to predict results with some what decent accuracy, it could provide a very interesting way to look at each gameweek and even to seem like nostradamus to our friends. The short answer is its not that easy and an extremely complicated model is required to provide a decent >50% accuracy return but even so we can try explore approaches and even learn some code along the way.
For this exercise I am going to look at the last 20 games of the premier league 2017/18 season, the season where Man City became centurions and just pipped Liverpool to the title on the last day.

To start off I want to collect all the closing prices provided by the bookmakers. In a previous article I explained the work of (Kaunitz, Zhong, and Kreiner 2017) who concluded the closing odds are a powerful (if not the best) proxy of a teams true probability of winning a match. Also the betting odds are the only information available before a match, of course in game stats like xG and shots could be used but before a match all there is available are the betting odds, the rest is known after the fact.
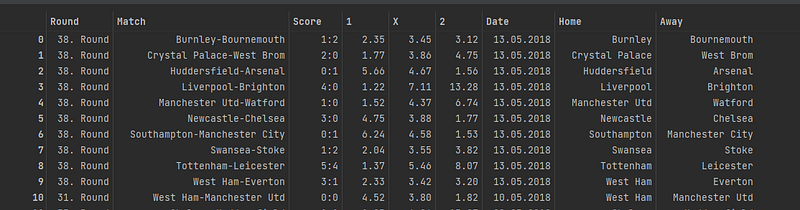
Betexplorer provides the closing line data via Oddsportal. So to start the script needs to scrape all this data and store in a df.
I will not break down what each segment does but essentially I am retrieving the information of interest from the page. Since the matches are scraped from last to first I can simply reverse the df to get it from start to finish.
from tabulate import tabulate
import requests
import pandas as pd
from bs4 import BeautifulSoup
import warnings
from sklearn.model_selection import train_test_split
from sklearn import metrics
from sklearn.ensemble import RandomForestClassifier
from sklearn.model_selection import GridSearchCV

warnings.filterwarnings('ignore')

url = "https://www.betexplorer.com/soccer/england/premier-league-2017-2018/results/"
soup = BeautifulSoup(requests.get(url).content, "html.parser")


def get_odd_or_text(td):
    if "data-odd" in td.attrs:
        return td["data-odd"]

    odd = td.select_one("[data-odd]")
    if odd:
        return odd["data-odd"]

    return td.get_text(strip=True)


all_data = []
for row in soup.select(".table-main tr:has(td)"):
    tds = [get_odd_or_text(td) for td in row.select("td")]
    round_ = row.find_previous("th").find_previous("tr").th.text
    all_data.append([round_, *tds])

df = pd.DataFrame(
    all_data, columns=["Round", "Match", "Score", "1", "X", "2", "Date"])


df['Home'] = [i.split('-')[0] for i in df['Match']]
df['Away'] = [i.split('-')[1] for i in df['Match']]
#reverse df
df = df.iloc[::-1]
dfThe result provides the df below.
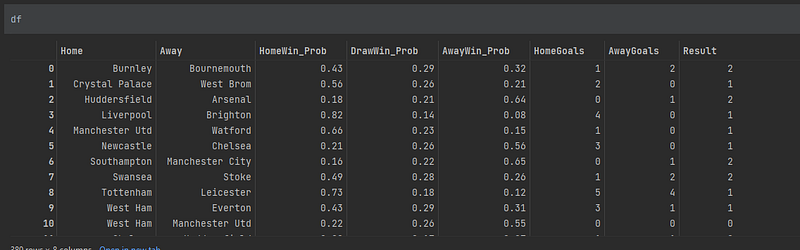
The next part I need to change the odds from string to numeric. I set the columns to change in a list and use apply with pd.to_numeric to change only these columns. I then create probabilities of the odds for the model by dividing by 1. Lastly I need to seperate the goals by home and away to create a multi-classification problem with the target of result being what I want to predict.
cols = ['1','X','2']

df[cols] = df[cols].apply(pd.to_numeric, errors='coerce')
df['HomeWin_Prob'] = round(1/df['1'],2)
df['DrawWin_Prob'] = round(1/df['X'],2)
df['AwayWin_Prob'] = round(1/df['2'],2)

df['HomeGoals'] = [i.split(':', 1)[0] for i in df['Score']]
df['AwayGoals'] = [i.split(':', 1)[1] for i in df['Score']]
To turn this into a classification problem with 3 outcomes I use a function that states if a home team outscores away its a home team win, if its level its a draw and if the away team outscores the home team its an away win. I use apply to create this new target column.
def Result(df):

    if df['HomeGoals'] > df['AwayGoals']:
       return 1
    if df['HomeGoals'] == df['AwayGoals']:
       return 0
    if df['HomeGoals'] < df['AwayGoals']:
       return 2

df['Result'] = df.apply(Result,axis=1)df.drop(['Round','Score','Date','1','X','2','Match','HomeGoals','AwayGoals'],axis=1,inplace=True)Now the dataframe is nearly ready to apply a the random forest. The Home and Away goals are dropped from this dataframe.
I slice the columns taking the last 20 matches as the hold out set. The model will not see this during creation and I will use this to predict the last two game weeks. The rest of the matches will be used to train and test. The result column needs to be dropped from the hold_out also.
hold_out = df[360::]
df = df[0:360]hold_out.drop('Result',axis=1,inplace=True)Machine learning models dont like text values which the team names are, so a dictionary can be used to recode the team names from 0–19. I need to do this for both hold out and model file. A lambda function applies the recoding through iteritems.
model_recode = {'Burnley':0,
              'Crystal Palace':1,
              'Huddersfield':2,
              'Liverpool':3,
              'Manchester Utd':4,
              'Newcastle':5,
              'Southampton':6,
              'Swansea':7,
              'Tottenham':8,
              'West Ham':9,
              'Chelsea':10,
              'Leicester':11,
              'Manchester City':12,
              'Arsenal':13,
              'Bournemouth':14,
              'Everton':15,
              'Stoke':16,
              'Watford':17,
              'West Brom':18,
              'Brighton':19}


# iterate over columns
for key, value in df['Home'].iteritems():
    df['Home'] = df['Home'].apply(lambda x: model_recode.get(x,x))

for key, value in df['Away'].iteritems():
    df['Away'] = df['Away'].apply(lambda x: model_recode.get(x,x))

for key, value in hold_out['Home'].iteritems():
    hold_out['Home'] = hold_out['Home'].apply(lambda x: model_recode.get(x,x))

for key, value in hold_out['Away'].iteritems():
    hold_out['Away'] = hold_out['Away'].apply(lambda x: model_recode.get(x,x))
Model Creation
Random forest (Breiman, 2001) is one of the most powerful ensemble models available. It is essentially a bigger collection of Decision Trees and works by bagging. Bagging works by choosing a random sample of data in a training set with replacement — meaning that the individual data points can be chosen more than once. After several data samples are generated, these models are then trained independently, and depending on the type of task — i.e. regression or classification — the average or majority of those predictions yield a more accurate estimate. This approach is commonly used to reduce variance within a noisy dataset. (IBM Cloud Education 2020)
By training on different samples of the data the Random forest reduces variance and limits the possibility of overfitting. Overfitting is a huge problem in machine learning so the use of a random forest allows us to mitigate against this. Each individual tree in the random forest spits out a class prediction and the class with the most votes becomes our model’s prediction. The fundamental concept behind random forest is a simple but powerful one — the wisdom of crowds. (Yiu , 2018)
To begin the application of the RF I used the train_test_split class from sk-learn with a 80/20 split. Random_state allows for the same results to be provided each time.
X = df.drop('Result',axis=1)
y = df['Result']

X_train, X_test, y_train, y_test = train_test_split(X, y, test_size=0.2, random_state=42)
I applied parameter tuning via Grid Search as best practice to try get the best model possible. I set the criteria in the parameter_dict and tested each parameter.
# use ensemble Random Forest method to improve accuracy. First we must perform GridSearchCV to find out the best params.def model_tuning_GS(model, parameter_dict):
"""Function to perform hyperparameter turning for the classification models using GridSearch."""
# inspect the model params.
model.get_params()
# define the parameters using a dictionary that we want to test.
model_grid = parameter_dict
# initialise a GSCV object with the model as an argument. scoring is set to accuracy and CV set to 5.
Grid_model = GridSearchCV(estimator=model, param_grid=model_grid, cv=10, scoring="accuracy")
# fit the model to data.
Grid_model.fit(X_train, y_train)
# extract the best estimator, accuracy score and print them.
print("GridSearchCV results:", model.__class__.__name__)
# print best estimator
print("Best Estimator:\n", Grid_model.best_estimator_)
# printing the mean cross-validated score of the best_estimator:
print("\n Best Score:\n", Grid_model.best_score_)
# printing the parameter setting that gave the best results on the hold out testing data.:
print("\n Best Hyperparameters:\n", Grid_model.best_params_)
# call the GridSearchCV function on the random forest.
parameter_dict = {'n_estimators': [1, 2, 3, 4, 5],
'max_depth': [1, 5, 8, 9, 10],
'min_samples_leaf': [0.1, 0.2],
'criterion':['gini', 'entropy', 'log_loss']}
model_tuning_GS(RandomForestClassifier(random_state=42), parameter_dict)This function prints out the results, we can see the best parameters to use below. (Due to the nature of parameter tuning it is possible you get different results) Cross validating the search ten times averages out the scores.
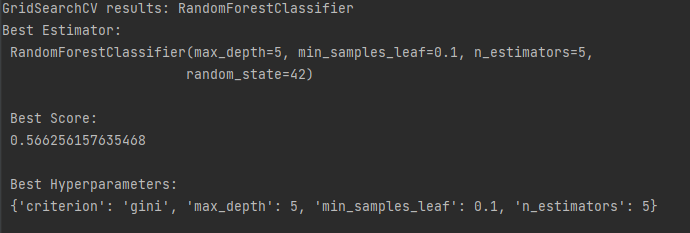
clf = RandomForestClassifier(criterion='gini', max_depth=5, min_samples_leaf=0.1, n_estimators=5, random_state=42)
clf.fit(X_train, y_train)
# use random forest to make predictions
y_pred = clf.predict(X_test)
# print the accuracy
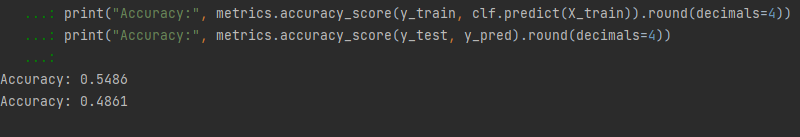
print("Accuracy:", metrics.accuracy_score(y_train, clf.predict(X_train)).round(decimals=4))
print("Accuracy:", metrics.accuracy_score(y_test, y_pred).round(decimals=4))This returns a accuracy score for the training set of Accuracy: 0.5486 and Accuracy: 0.4861 for the test set so I can conclude it hasnt overfitted.Unsurprisingly it is not an exceptional model which shows how hard it is to truely predict football but we will continue on.
I then use the model predict function on the unseen hold out set. I use pd concat to join them together.
# Make predictions on hold out set.
predictions = clf.predict(hold_out)

predictions = pd.DataFrame(predictions,columns=['Predicted_Result'])

predictions = pd.concat([predictions,hold_out],axis=1)
Remember when we coded each team to be a numeric value to work with the model? We can reverse that to get the team names back with the nifty piece of code in inv_map. It reverses the dictionary set earlier and by using the same for loops over the columns the teams are back. Finally, I like to use tabulate which prints out the results in a nice form.
# iterate over columns
for key, value in predictions['Home'].iteritems():
predictions['Home'] = predictions['Home'].apply(lambda x: inv_map.get(x,x))
for key, value in predictions['Away'].iteritems():
predictions['Away'] = predictions['Away'].apply(lambda x: inv_map.get(x,x))
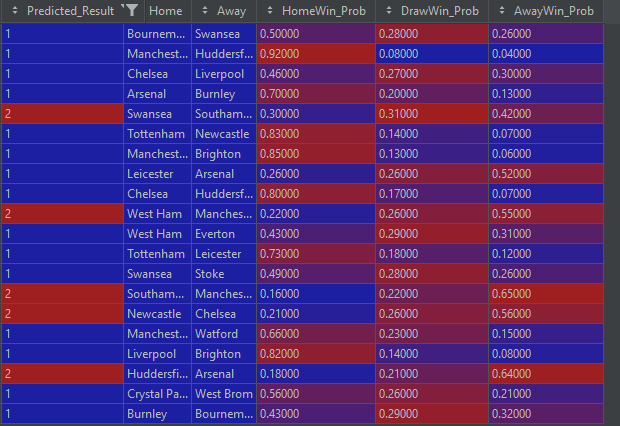
print(tabulate(predictions,headers='keys'))The end result is a dataframe with the model predictions. Remember 1 is a home team win, 0 is a draw and 2 is an away victory.
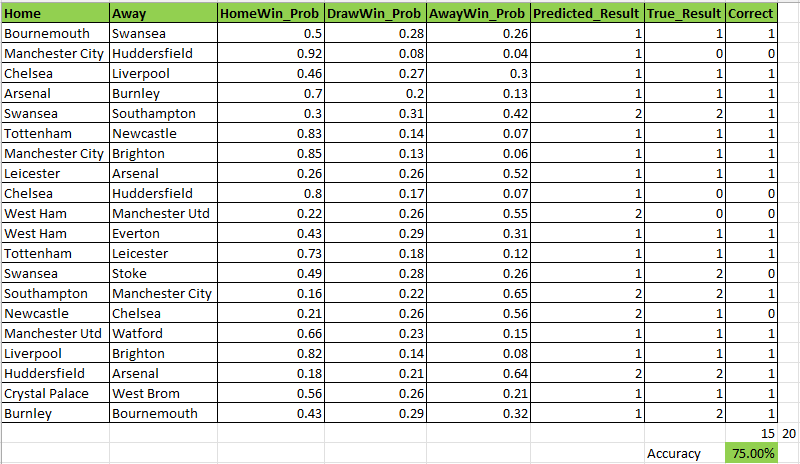
So lets see how the model performed in real life, seeing as its a couple of years ago the results are easily corroborated. The hope is that it gets at least 50% of the matches correct just as the testing showed.
What is amazing is that it is 75% accurate and had man city beat huddersfield with a probability of 92% the score would have been higher. Whats not as amazing is that the model did not predict a single draw and the games involved heavy favourites so it wasnt exactly going out on a whim. It did predict a nice win for Leicester against Arsenal though which is the biggest outsider. Other than that it tended to side with the favourites. Due to the low sample size there is a lot of sample bias and no firm conclusions can be made other than it was a lot of fun!
Improvement
Predicting Premier League is not easy and as we have seen most attempts will not provide high accuracy scores. In my opinion a model should be created to manufacture its own closing probabilities of a team winning and it would yield stronger performance. Details of xG, territory dominance, passing and shots would create a model to price up football better than using an approach used here. I also did not scale but it is not expected to improve model performance drastically here.
Neural networks could be the answer here and I will pursue such a project in the future.
I hope you enjoyed and learnt a few bits to help, maybe you might start a model for this season with new/other metrics. Follow me for more football content and let me know in the comments if you are working on a model of your own! The full code is here.