
Predicting Singapore HDB Resale Price: Data Preparation
How to manipulate the dataset with necessary feature engineering efforts to prepare for further analysis and modeling

In Singapore, for young working adults who are about to start a family, HDB(Singapore Public Housing) would be their first choice when they have a limited budget. However, it could become a real headache for those who are considering which HDB flat to choose: town areas, nearby facilities(e.g. schools, shopping malls), flat types, etc. To make people’s life easier when facing such significant choices, I decided to do a study for Singapore HDB resale price, explore what are the key factors affecting HDB resale price, and make some recommendations for people who are planning to purchase an HDB in a near future.
Getting to know the dataset
The HDB resale data can be retrieved from data.gov.sg. Below is an example of the columns available from the raw dataset:
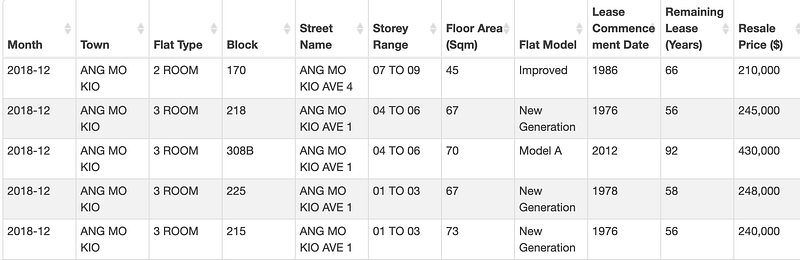
Below are some of the first impressions when I first look at these columns:
Month: Given in the format of year-month. We may retrieve the year data from this column, which may be useful when analysing the time trend for HDB resale price.
Town: Town location should be one of the key factors affecting HDB resale price — we are generally expecting an HDB flat in Orchard has a much higher resale price than Yishun given the same flat type.
Flat Type: There are 7 different kinds of flat types: 1 Room, 2 Room, 3 Room, 4 Room, 5 Room, EC and Multi-generation. Among which the 4 Room HDB flats are the most popular ones in Singapore. We may consider using 4 Room data samples to construct the model.
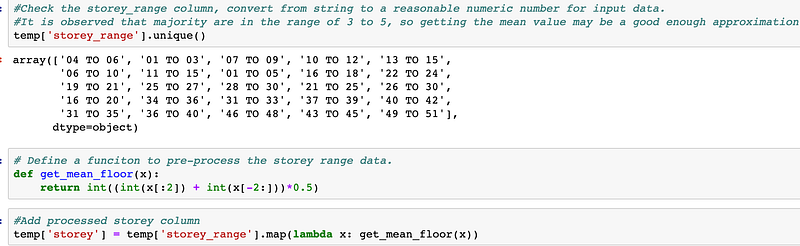
Storey Range: This column is given as a string rather than numbers, we may need to do some data munging accordingly if we want to use it to build the model.
Flat Model: Similarly, there are plenty of different flat models out there(35 different types). This factor would play an important role in the overall flat price. E.g., the DBSS (Design, Build and Sell Scheme) flats would have a higher resale price considering it allows buyers to design the HDB based on their own style.
Remaining Lease: Singapore HDB has a lease of 99 years. This column data has quite some NULL values, and it is calculated based on different years. We may need to adjust this column data accordingly when building the model.
Feature Engineering
After getting some rough ideas about the dataset, we may start to do data wrangling. Below are some feature engineering works I have performed to pre-process corresponding data columns:
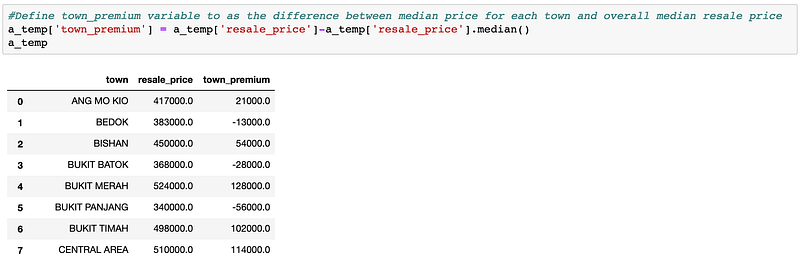
Town: To use this data column as input for the regression model, I have aggregated the dataset by Town, and take the median resale price for each town to subtract the overall median resale price. The result (‘town_premium’ column) can be interpreted as the amount of money one needs to pay additionally when they choose this location. For instance, one may need to pay an additional ~12.8k on average when buying HDB flats in Bukit Merah, while one can pay ~5.6K less if they choose an HDB flat in the Bukit Panjang area.
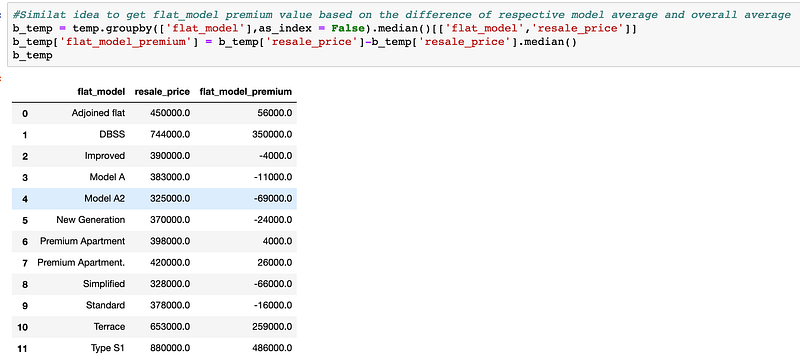
Flat_Model: Similar pre-processing is done for the “flat_model” column as well. As mentioned previously, we do see the DBSS HDB flats resale price is higher than average, one may need to pay an extra ~35K on average for this flat type.
Storey_Range: I just simply took the mean value from the two numbers in the given string. For example, for the range of “04 TO 06”, I will just assign the storey to be 5. It should be a good enough approximation, given the storey range spread is not really larger for each category (3 or 5 storey difference).
Remaining Lease: The original remaining lease column contains NULL values, and they are referenced to different years depending on the year of retrieval date. I have re-calculate the remaining lease value at the resale date with the following formula:
Formula: remain_lease = lease_commence_date + 99 –resale_year
What can we obtained from “Street Name”?
So now we have preprocessed the majority of columns in the raw dataset. Looks all good… Wait, how about the “Street Name” column?
As mentioned earlier, this column actually indicates the geographical location data for each HDB flats. It is actually a key factor for HDB resale price, as it would indicate if the HDB is near any MRT station, or if there are any shopping malls nearby. This information should be quite important based on my experience when renting HDB flats, and I believe it should apply to HDB resale price as well.
We may try to use GoogleMap or other available map API to extract the longitude and latitude for different street names, MRT stations, and major shopping malls. Then we can obtain the relative distance from these street names to their nearest MRT and shopping mall as metrics for resale price prediction.
After doing some research, I noticed that Onemap.sg offers an API that enables users to conveniently query the longitude and latitude given a specific address. I write a simple python script to query location information using One map API.
We can do the same thing to retrieve both Singapore MRT/Shopping Mall longitude/latitude information. The list of Singapore MRT stations could be found here, and the list of major shopping malls in Singapore can be extracted from here.
One additional piece of information we need to capture is, which is the closest Mall/MRT given the street name. We may just calculate the relative distance for a street name with each Mall/MRT with a for loop and then obtain the smallest distance target accordingly. The sample code is attached for reference:
##Sample Script to obtain the closest shopping mall name given street nameimport openpyxl
import numpy as npdef calculate_distance(x,y):
return np.sqrt(((x[0]-y[0])*110.574)**2 + ((x[1]-y[1])*111.32)**2)wb = openpyxl.load_workbook('Street_Name_List.xlsx')
wb2 = openpyxl.load_workbook('Shopping_Mall_List.xlsx')
sheet = wb['Sheet1']
sheet2 = wb2['Sheet1']
for row in range (2, sheet.max_row +1):
Distance = 200
MRT = 0
if sheet['B'+str(row)].value is not None:
for k in range (2, sheet2.max_row + 1):
x1 = sheet['B'+str(row)].value
x2 = float(sheet2['B'+str(k)].value)
y1 = sheet['C'+str(row)].value
y2 = float(sheet2['C'+str(k)].value)
#print (type(x1),type(x2),y1,y2)
Dis_Temp = calculate_distance([x1,y1],[x2,y2])
if Dis_Temp < Distance:
Distance = Dis_Temp
MRT = k
else:
continue
else:
continue
print(MRT)
print(sheet2['A'+str(MRT)].value)
sheet['F'+str(row)].value = sheet2['A'+str(MRT)].valuewb.save('Street_Name_List.xlsx')
print('Job Done.')If you follow along the way, now you should have already obtained the closed MRT/shopping mall name for each street name in the dataset. With all the longitude/latitude data queried from API, we can easily calculate the relative distance from each street to their closet MRT/Shopping Mall. For easier visualisation, I have converted the relative distance(km) into the time needed by walking (mins) from the corresponding street (1 mins walk is mapped to 80 meters distance on average).
Another interesting metric I can think of is the travelling time by public transport from the nearest MRT station to the CBD (for example, Raffles Place MRT station). This could be an important metric to look at for young working adults who use MRT as the major means of transportation, since buying a car in Singapore is not really affordable for everyone.
Instead of calculating the time based on our own estimation, we can use the OneMap API routing service to query the travelling time by public transport. More details for the API usage can be found here.
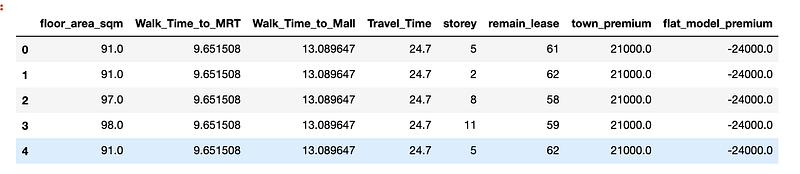
With all the feature engineering works mentioned above, we have finally obtained the dataset with desired features below:
(Note: The Walk_Time_to_MRT, Walk_Time_to_Mall and Travel_Time_to Raffles are all in mins. town_premium & flat_model_premium are all in Singapore Dollars)
Before we move on to modelling, we will explore more about the dataset first and find some interesting patterns from it. This will be covered in the next post (See below). Thanks for reading!


