PREDICTING CUSTOMER CHURN WITH MACHINE LEARNING

Introduction
In this project, a machine learning model will be used to predict customer churn in a Telco company. The CRISP-DM process up to the evaluation phase.
The CRoss Industry Standard Process for Data Mining (CRISP-DM) is a process model that serves as the base for a data science process. It has six sequential phases:
- Business understanding — What does the business need?
- Data understanding — What data do we have/need? Is it clean?
- Data preparation — How do we organize the data for modeling?
- Modeling — What modeling techniques should we apply?
- Evaluation — Which model best meets the business objectives?
- Deployment — How do stakeholders access the results?
What is CRISP-DM? — Data Science Process Alliance (datascience-pm.com)
BUSINESS UNDERSTANDING
At this phase, the following will be done:
· Project description
· Hypothesis formulating
· Research questions
Project description
Building a model that predicts customer churn
Hypothesis
Null Hypothesis: Customers with high total charges are likely to churn
Alternate Hypothesis: Customers with high total charges are not likely to churn
Research Questions
1. Do customers who have subscribed to online security from the company likely to churn?
2. Is there a relation between total charges and the likelihood of customers churning?
3. How does the length of a customer’s contract affect their likelihood to churn?
4. How do customers’ total monthly charges impact their decision to churn?
5. Does the payment method contribute to why customers churn?
6. What is the rate of customer churn concerning the billing method?
DATA UNDERSTANDING
Here, the following will be done:
· Exploratory data analysis on the datasets
· Highlight issues in the data and
· Finding solutions to issues identified
Exploratory data analysis on the datasets
The various datasets were previewed to find possible issues. In doing this, basic packages for the analysis were loaded.
· Pandas: for cleaning and manipulation
· Numpy: for leaning and manipulation
· Matplotlib: for visualization
· Seaborn: for visualization
· Plotly: for visualization
Highlight issues in the data
The data for this project is in a csv format. The following describes the columns present in the data.
Gender — Whether the customer is a male or a female
SeniorCitizen — Whether a customer is a senior citizen or not
Partner — Whether the customer has a partner or not (Yes, No)
Dependents — Whether the customer has dependents or not (Yes, No)
Tenure — Number of months the customer has stayed with the company
Phone Service — Whether the customer has a phone service or not (Yes, No)
MultipleLines — Whether the customer has multiple lines or not
InternetService — Customer’s internet service provider (DSL, Fiber Optic, No)
OnlineSecurity — Whether the customer has online security or not (Yes, No, No Internet)
OnlineBackup — Whether the customer has online backup or not (Yes, No, No Internet)
DeviceProtection — Whether the customer has device protection or not (Yes, No, No internet service)
TechSupport — Whether the customer has tech support or not (Yes, No, No internet)
StreamingTV — Whether the customer has streaming TV or not (Yes, No, No internet service)
StreamingMovies — Whether the customer has streaming movies or not (Yes, No, No Internet service)
Contract — The contract term of the customer (Month-to-Month, One year, Two year)
PaperlessBilling — Whether the customer has paperless billing or not (Yes, No)
Payment Method — The customer’s payment method (Electronic check, mailed check, Bank transfer(automatic), Credit card(automatic))
MonthlyCharges — The amount charged to the customer monthly
TotalCharges — The total amount charged to the customer
Churn — Whether the customer churned or not (Yes or No)
Notes after previewing the data
Only the total charges column had null values. This will be resolved by imputing with the mean method.
DATA PREPARATION AND ANALYSIS
In this phase, the following will be done:
· Cleaning of the dataset for analysis
· Answering research questions
Cleaning the data
Here, since many errors were not seen when we did a little exploration by using the info and isnull method, we are going to answer the research question which will allow us to dive deep into exploring the data.
Answering research questions
- Do customers who have subscribed to online security from the company likely to churn?
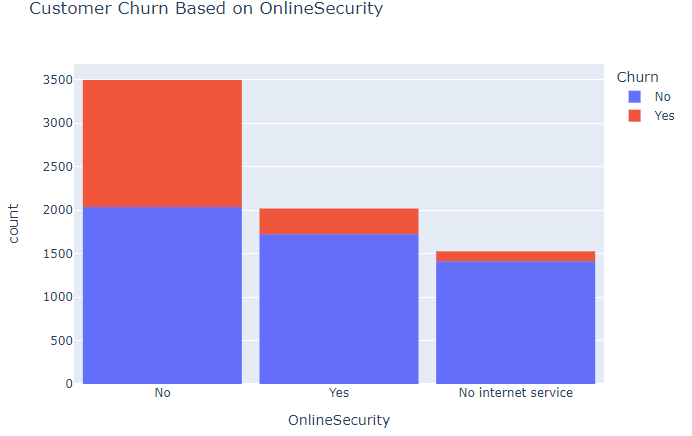
It’s seen that customers churn irrespective of the type of online security. But taking into consideration only the customer who were churning it’s not quite surprising that customers with ‘No’ online security were churning most. More than twice as much as customers who had online security and customer who had no online presence at all.
2. Is there a relation between total charges and the likelihood of customers churning?
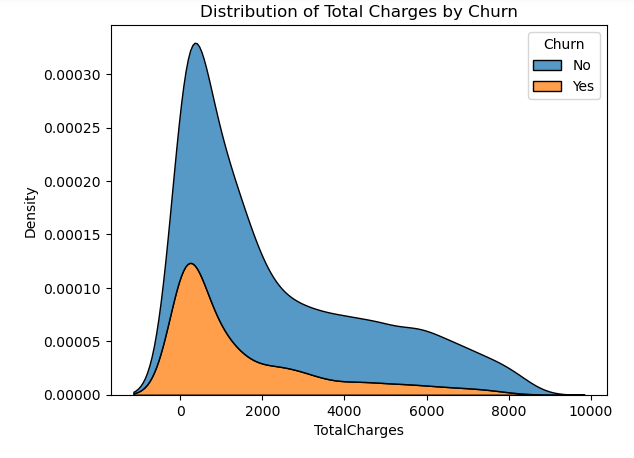
From the visualization, it can be seen that the increase in total charges is not affecting customer churn and only a few customers are likely to churn with an increase in total charges.
3. How does the length of a customer’s contract affect their likelihood to churn?
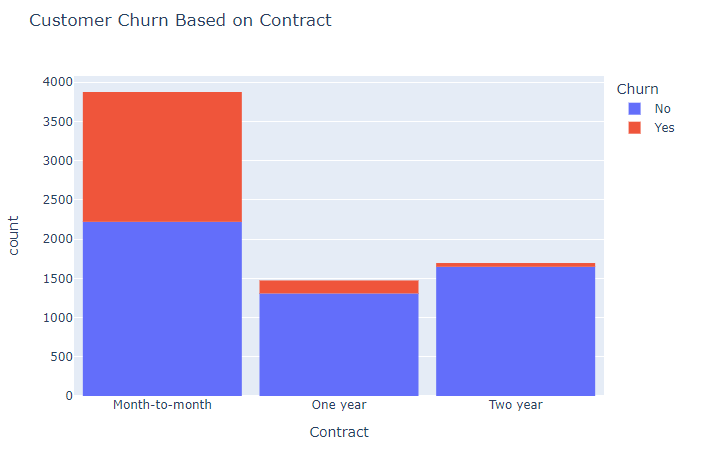
It’s seen that customers churn irrespective of the type of contract. But taking into consideration only the customer who were churning it can be seen that customers with the month-to-month contract were churning the most. Which was more than customers who had one-year and two years contracts.
4. How do customers’ total monthly charges impact their decision to churn?
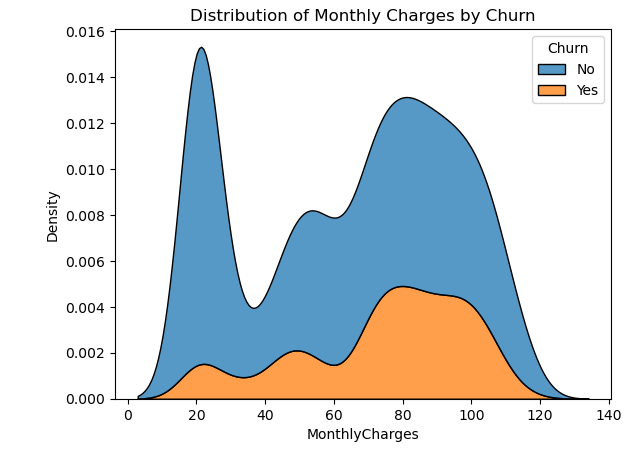
High monthly charges do not affect customer churn and it can be seen that few customers churn with an increase in monthly charges.
5. Does the payment method contribute to why customers churn?
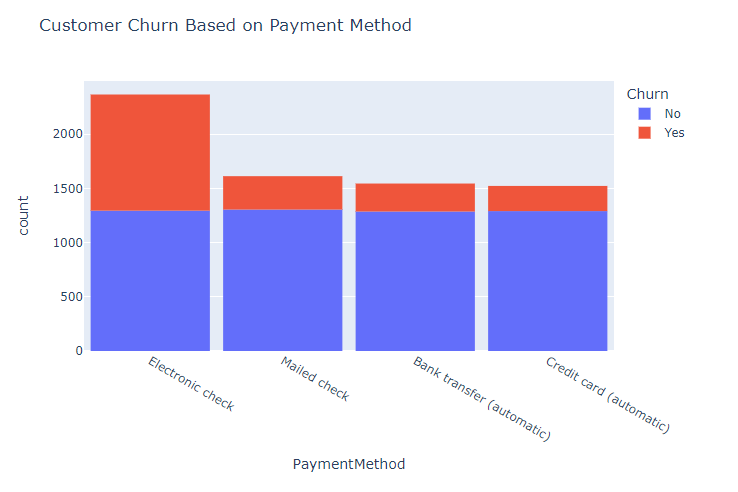
Customers churn irrespective of the type of payment method. Customers who use the electronic check method were churning more as compared to the various payment methods and their number of customers churning.
6. What is the rate of customer churn concerning the billing method?
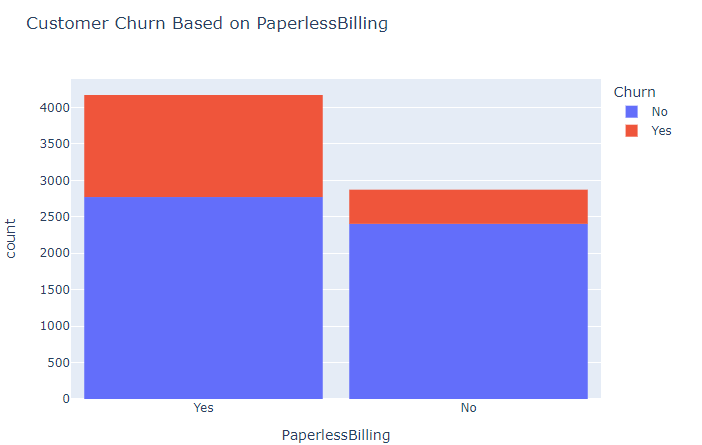
There are quite a number of customers who are churning despite subscribing to the paperless billing unlike those who have not subscribed.
MODELING
Let’s take a look at the visualization of the target in the dataset which is the churn.
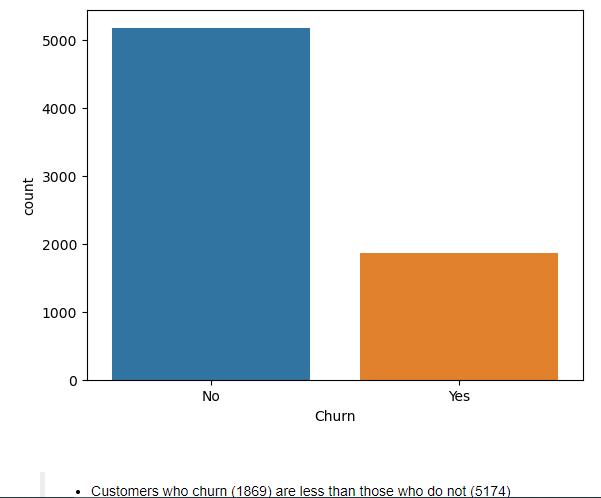
The visualization depicts that the data is imbalanced with the majority class as ‘No’ (Customers are not churning). Building a model with this is going to bias toward the majority class. Meanwhile, the interest here is to be able to predict customers who are churning (Yes).
Hence the SMOTE (Synthetic Minority Oversampling Technique) oversampling technique will be used to balance the data and also tree-based models will be used. The metric of focus will be the F2 score. This is because the F2 score gives more importance to recall than precision and, in our case, we would like a model to be able to predict true positive cases.
Detailed processes on feature engineering and scaling and step-by-step model building are found in the Jupyter notebook.
Model Building Results
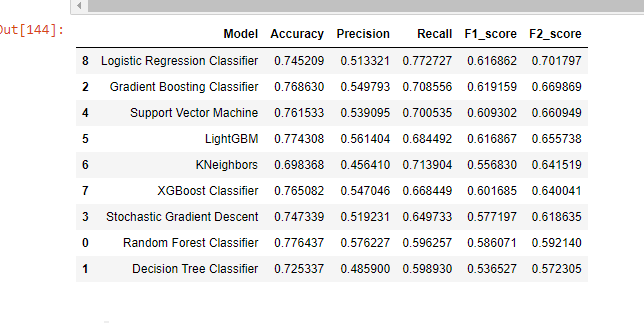
This DataFrame displays the results of the various models sorted by the F2 score. From the results, the Logistic Regression Classifier performed well in predicting customer churn by 70%. It is followed by the Gradient Boosting Classifier (67%), Support Vector Machine (66%), and others. It can be seen that the best-performing model is the Logistic Regression Classifier.
MODEL EVALUATION
Hyperparameter Tuning
Since we have our best model, it will be tuned with different parameters to enhance its performance.
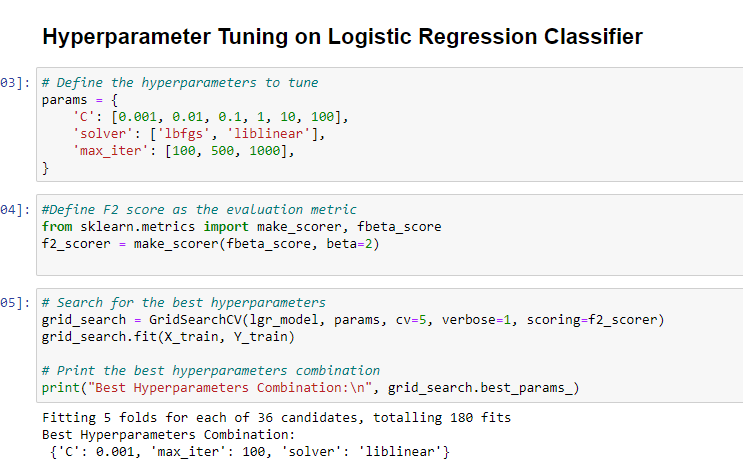
This shows the various parameters and the best hyperparameters combination. Let’s try this on the testing set.
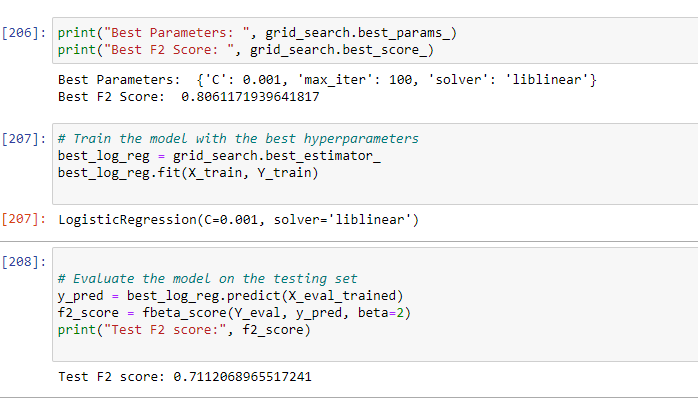
The best parameters gave an F2 score of 0.80 and after training the model with the best hyperparameters, an F2 score of 0.71 (71%) was achieved.
Before performing hyperparameter tuning on the Logistic Regression model, its F2_score was: 0.701797 and after tuning, its F2_score became: 0.711206
It’s therefore doing well in predicting customers who churn. This means that since F2_score gives more weight to recall, the model is doing well in predicting correctly the number of actual positive cases which in our case is the ‘Yes’ (Churn).
Conclusion
In this project, we sought to predict customer churn with a machine-learning model. Exploratory data analysis was performed to get in-depth knowledge of the data after which a model was built to predict customer churn.
Attached is the link to GitHub where a more detailed explanation of the work can be found.
Comments and suggestions are welcome to help me improve my skills. Thank you.


