
Precision and Recall — A Comprehensive Guide With Practical Examples
All you need to know about accuracy, precision, recall, F-scores, class imbalance and confusion matrices

Suppose my job is to develop a credit card fraud detection model for a bank. In reality, let’s say only 0.1% of transactions is fraudulent. I cleverly assume that no transactions are fraudulent, and boast a 99.9% model accuracy (i.e., the % of correct classifications). I pat myself on the back and crack open a cold one.
However, my employer not happy. Despite being a highly accurate model, it does not do anything to detect fraud, and as such does not address the underlying business problem. Seems we need another performance metric.
So why doesn’t accuracy work here? A common feature of machine learning problems is that we must deal with class imbalance. It is quite typical that the number of data points in one class (positive) overwhelmingly exceeds the number in the other class (negative). However, it is often the anomalies that we try to detect: diseases, fraud cases, security hazards, etc.
As accuracy doesn’t cut it here, let’s see what we do need.
Context
First of all, the question on what performance metric to use should always be driven by the problem you aim to resolve, the insights you try to obtain. Although it sounds obvious, still too many people navel-gaze at certain metrics without addressing the why question.
True and False, Positive and Negative
Time for a bit of terminology. Often, we identify data we are interested it (a fraud case, a certain decease, a cat picture) as positive, and the remaining data as negative. We can easily extend it to multiple classes (e.g., cat, dog, elephant, mouse), but let’s stick with the binary approach here.
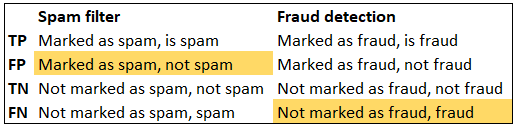
Our model may either correctly (true) or incorrectly (false) predict the actual class, be it positive or negative. So we have four flavors of categorization, which are often summarized in a confusion matrix:
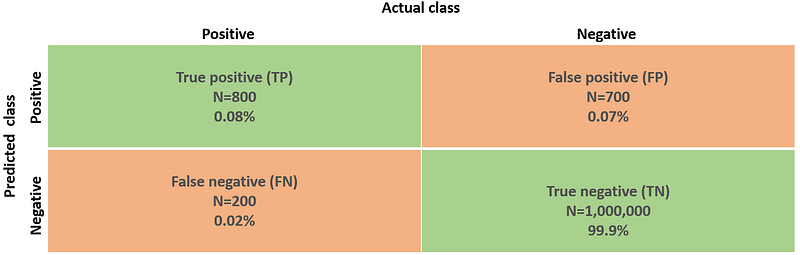
The absolute numbers and percentages convey a lot of information, but do not tell the full story. Not all quadrants weigh equally heavy in practice — it depends on the aforementioned context. For instance, in medical settings false negatives (undiagnosed diseases) may have disastrous consequences, whereas false positives may be corrected during a follow-up examination (at extra cost though). Accuracy does not capture any of these insights.
Long story short: we need some new metrics.
Accuracy
Accuracy simply considers the ratio of correct classifications for all data. Staying within the terminology, we can define it as follows:

Note that many loss functions and error metrics steer on accuracy. By default, every wrongful classification is often penalized equally. As already shown in the fraud detection example, accuracy might give a very poor insight into a model’s performance, especially when dealing with class imbalance.
Precision
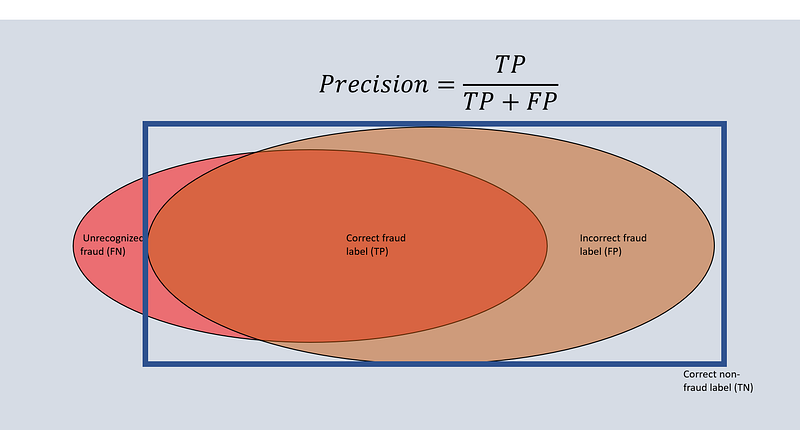
Precision is concerned with the fraction of true positives and all positives:
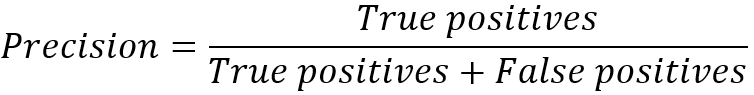
It tells how valid results are. In other words, it states how many retrieved elements are relevant. A high precision indicates that, if the algorithm states an element is positive, it probably indeed is.
[to memorize, I sometimes find it helpful that Precision only deals with Predicted positives]
Getting back to the fraud example: precision would tell what fraction of the identified cases actually are fraudulent. Suppose we correctly identify 800 (true positive) and incorrectly identify another 700 (false positive); our precision would be 0.53.
Recall
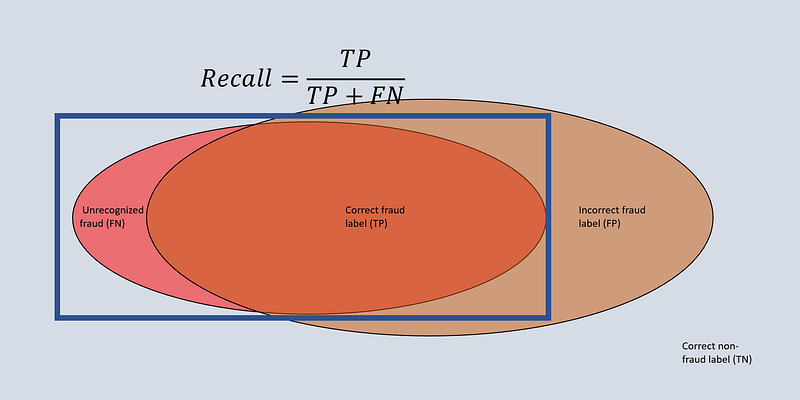
Recall describes the fraction of true positives and all positives (i.e., including false negatives):
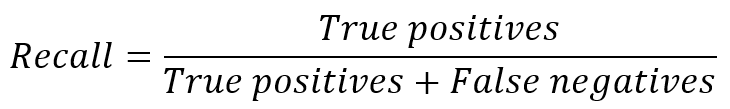
This metric tells us how complete our results are, e.g., how many relevant elements are retrieved. A high recall implies that a large fraction of truly positive elements are captured.
[Recall might be memorized by considering Real positives (note that a false negative is a positive in reality)]
Again, consider the fraud example. Suppose we identify 800 instances (true positives) out of 1000 (including 200 false negatives). Our recall would be 0.8.
Note that by simply labeling many elements as positive you can achieve high recall, yet this is often undesirable. Suppose we flag a large number of transactions as fraudulent. The set may indeed contain all fraudulent transactions, but also many false positives that require manual handling (=costs). Observe that we are dealing with a tradeoff between precision and recall here.
F-scores
We established that precision and recall both provide useful insights, but it would be convenient to express the balance between them in a single number. This is what the F-score does. More precisely, it is a harmonic mean of precision and recall. The simplest (and most common) F-score is the balanced F-score, also known as F_1. The 1 indicates that it weighs precision and recall equally. It is denoted by
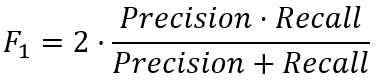
Note that, by multiplying precision and recall (numerator), discrepancies between both metrics are penalized. If we have precision 0.8 and recall 0.2, the F-score is only 0.32. If both are 0.5, the F-score is also 0.5. Alternative F-scores (e.g., F_0.5, F_2) put more weight on either precision or recall.
Precision-recall curve
Another way to express the tradeoff is the precision-recall curve. Typically, the more true positives you identify, the more false results come along with it. Think of the classifier algorithm as a sort of gatekeeper, using a certain acceptance threshold. A very critical one may only let a certain element pass when very sure of his case (high precision), at risk of rejecting true positives. A more lenient one might pass on more elements, capturing more of the total population (high recall), yet also introducing more incorrect classifications.
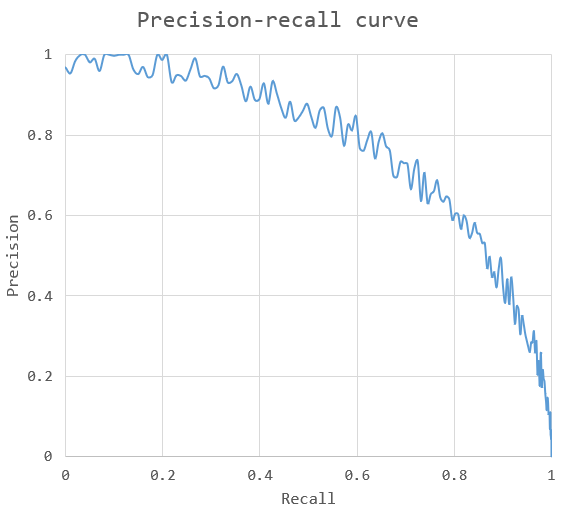
The area under the curve (AUC) provides insight into the quality of the model. A perfect model has AUC=1, with both precision and recall always being 1.0. A ‘good’ model would bow to the (1,1) point, covering a large area.
How to deal with class imbalance?
Now we know how to measure performance under class imbalance, but what do we do with this information? Suppose we notice our fraud detection model has low recall, how do we fix that?
Oftentimes, problems with recall and/or precision stem from class imbalances. If the number of elements in a set is overwhelmingly negative and we optimize on accuracy, the small fraction of positives hardly puts a dent in overall performance. Remember, a straightforward loss function measures all incorrect classifications (false negative and false positive) equally.
A full assessment is out of scope here, but there are two general solution directions: (i) we weigh some misclassifications heavier than others and (ii) we train on subsets containing fewer negatives.
First, let’s check weighing. By adjusting the loss function, we can influence training. In the fraud detection case, we likely prefer to label too many cases as potentially fraudulent than too few. In other words, we steer towards high recall. By more heavily penalizing false negatives, we train the algorithm to label more cases as positive (at the risk of increasing false positives).
It works the other way around as well. If we design a spam filter, we’d better be sure the detected e-mail is indeed spam. When in doubt, it’s better to let the user decide whether the e-mail is relevant. Here, we prefer high precision and would penalize false positives (not spam, but marked as such) the most.
The second solution entails re-adjusting the sample. It is a bit more sophisticated than I put it here, but a Machine Learning algorithm has an easier time classifying 1,000 positives and 1,000 negatives, than 1,000 positives and 1,000,000 negatives. In the latter case, the model will likely be tailored towards the much larger number of negatives. Alternatively, you might duplicate samples from the minority class to re-balance the set.
Final words
“Which false classifications have the most real-world impact?”
As for any machine learning problem, the questions should always relate to the purpose of the model. Memorizing metrics alone won’t help you much. Instead, focus on what misclassifications are more harmful and how to prevent them as much as possible, while preserving a healthy balance between precision and recall. Ultimately, remember that machine learning models are a means to an end, not the end goal itself.
Key takeaways
- Accuracy (total % of correct classifications) is often not a meaningful performance metric when data sets are imbalanced
- Class imbalance implies that one class is represented much more often than others. Penalizing certain misclassifications and re-sampling the data set help dealing with imbalances.
- Precision is a metric that penalizes false positives. As such, models with high precision are cautious to label an element as positive.
- Recall is a metric that penalizes false negatives. Models with high recall tend towards positive classification when in doubt.
- F-scores and precision-recall curves provide guidance into balancing precision and recall.


