
Portfolio Returns Explained
Learn How To Calculate Portfolio Returns
During a dinner party I attended last week, a friend and I began talking about our portfolio of investments. The focus naturally shifted to the equities bull market and we soon started talking about our yearly returns. What we quickly realised however, was that the numbers we were each quoting were not comparable. We were using different methodologies for calculating our returns.
In this article, we will go through some of the different ways that returns can be calculated and some of the pros and cons of each.

Summary
In summary, we will be covering the following calculations:
- Holding Period Returns
which in turn can be used to calculate:
- Mean Return
- Geometric Returns or Time Weighted Rate of Return (TWRR)
- Money Weighted Rate of Return (MWRR) or Internal Rate of Return (IRR)
- Modified Dietz
Holding Period Returns
When it comes to calculating the performance of a portfolio, one needs to compare the initial value of the portfolio versus the final one. Assuming the initial capital investment remains exactly the same for the investment period (if calculating yearly returns then a year apart). If so, we can calculate the returns as:
100 * (Final Value - Initial Value) / Initial ValueHowever, more often than not the capital investments in the portfolio change during the investment period. The capital invested can either increase or decrease. Either way, the return of the portfolio will be impacted and if one was to use the above formula, the results would be wrong.
To cater for this scenario, we calculate the portfolio return each time the capital invested changes.
Mean Return
The Mean Return, very simply refers to the average total return of the portfolio. You simply add together all the returns and divide by the number of them.
Take for instance the following numbers as your portfolio yearly returns for the past 3 years:
23, 30, -10Then the Mean Return gets calculated as:
Mean Returns = ΣR / N
= (23 + 30 + (-10)) / 3
= 14.3
The advantage of this calculation is its simplicity. It is however, a very bad metric for calculating meaningful returns. It skews portfolio returns by ‘hiding’ large standard deviations. If you are trying to impress your friends with your portfolio returns, this might be the one for you☺. Finally, this calculation method assumes that all of the returns are of regular intervals.
Time Weighted Rate of Return (TWRR)
The TWRR is another way of calculating portfolio returns, which better takes into consideration the risk associated with the portfolio (or standard deviation of returns). Moreover, this method of calculation does not assume that each holding period is of the same size. This method is also Global Investment Performance Standards (GIPS) compliant.
Let us examine how our portfolio’s return changes using TWRR from the previous example:
Returns: 23, 30, -10
TWRR =  (∏(1+r))^1/n)-1
=[((1.23)(1.3)(0.9))^1/3]-1
=12.9%
As you can see, there is a bit of difference between the two results. In general, the more time periods we take into consideration and the higher the volatility, the more the two values would be expected to diverge.
This difference, in the world of mathematics is known as the AM-GM inequality (the inequality of arithmetic and geometric means). The theory states that the AM of a list of non-negative real numbers is greater than or equal to the geometric mean of the same list and the two means are only ever equal if and only if every number in the list is the same.
The inequality can be expressed as:
Σx_i/n >= (∏x_i)^1/n
where
x_i is the number in the list
n is the total count of numbers in the list
In summary, the key takeaway is that the Geometric Mean (or Time Weighted RR), is more accurate for returns than the arithmetic mean.
Internal Rate of Return (IRR), or Money Weighted Rate of Return
The IRR is a measure of performance which highlights the rate which will discount the cash flows to the initial value of the capital invested.
It could potentially be calculated in the following way:
PV = CF0 + CF1/(1+ IRR) + CF2/(1+IRR)^2 + ... + CFn/(1+IRR)^n
where,
CFO = Initial Investment
CF1 = A future contribution of funds (or withdrawal)
Please note that the above formula, assumes that the time periods are fixed between each contribution/withdrawal. To make the time periods varied, we have to use the following formula:
PV = Σ [CF1 / ((1+IRR)^((d_i-d_0)/365)]
where,
CF_i = The cash flow we are considering
d_i = The date of the cash flow we are considering
d_0 = The original cash flow dateFor both of these equations we are looking for an IRR that will set the equation to zero. As such, to solve this equation the rate needs to be determined by trial and error.
However, being the sophisticated investors we are, we will not sit there and waste time working things out by trial and error. Instead, we will use excel and the built-in function XIRR.
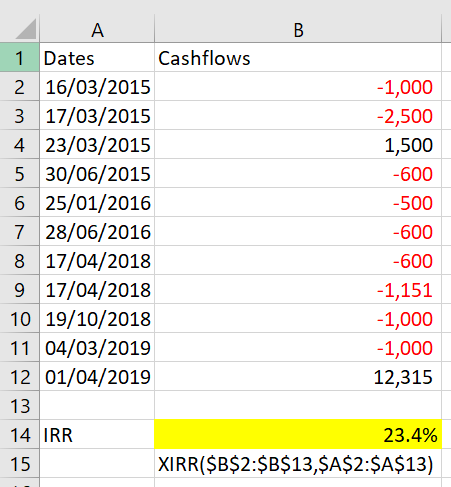
XIRR accepts two parameters: dates and cash flows. See example above.
NB: The IRR excel function will assume equal time periods, hence why we use XIRR.
Modified Dietz
Finally, another way to calculate the return of the portfolio is the Modified Dietz method. This is often referred to as the Modified IRR (MIRR), as it is quite similar. Modified Dietz however, is GIPS compliant; which means you might find some financial institutions are using this way to report their returns.
To calculate Modified Dietz, you will need to go through the following steps:
- Collate the portfolio’s valuation across different dates
- Collate the portfolio’s inflows and outflows of capital
- Interpolate the portfolio’s weighted cash flows on the chosen reporting dates through a time-weight matrix
- Calculate the Weighted Cash Flows
- Calculate the Total Cash Flows
- Calculate Periodic Returns
- Calculate Gross Periodic Returns
- Finally calculate the Annualised Returns
Example
Let us now go through an example of the above, so we can put it into practise:
- Collate the portfolio’s valuation across different dates
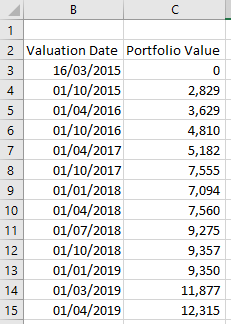
First, we begin by putting together, in a tabular format, the value of the portfolio on any recorded dates.
This will allow us to create a time-weights matrix which will ultimately enable us to distribute the returns according to the time period they have been observed in.
2. Collate the portfolio’s inflows and outflows of capital
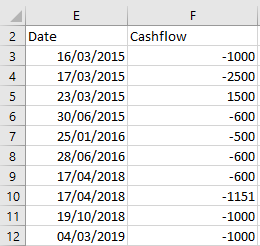
We also collate the portfolios inflows and outflows of capital. Note that minus represents the inflows here and not the outflows.
3. Interpolate the portfolio’s weighted cash flows on the chosen reporting dates through a time-weight matrix
For this example, we will create our time-weights matrix to support yearly reporting. On the top, we will put the reporting dates that we are after, and it will reference all the ‘Valuation Dates’ from above as it’s y-axis.
For each value, we as long as our Reporting Date is between two of the Captured Valuation Dates, we can calculate the weights ratio as:
Weights Ratio = (VD_(-1) - RD) / (VD_(-1) - VD_(0))
where,
VD_(-1) is the Previous Valuation Date
VD_(0) is the Current Valuation Date
RD is the Reporting Date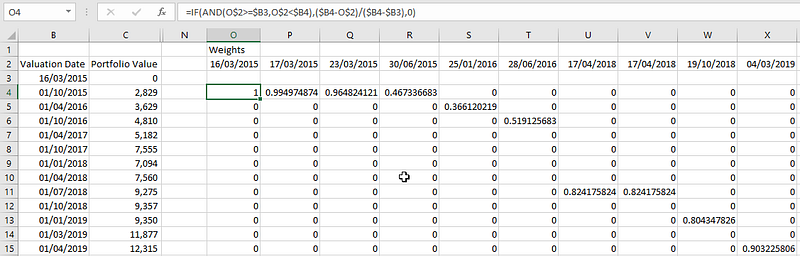
Now that we have the time-weight matrix, we can use it to calculate the Weighted Cash flows.
4. Calculate the Weighted Cash Flows
Essentially what this step will do, is calculate the impact of the cash flow across the different reporting dates. All we need to do, is multiply our Cash flows (From Step 2) with the weights we have calculated (From Step 3).
Using the MMULT function of excel to allow us to make our life easier:
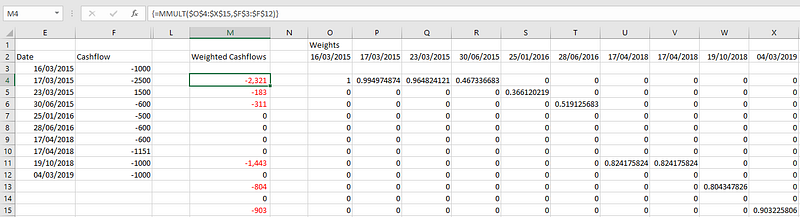
To make it clearer, the first entry is calculated by:
=F3*O4+F4*P4+F5*Q4+F6*R45. Calculate the Total Cash Flows
The Total Cash Flows can be calculated by adding together the Cashflows where an associated weight is present. In excel, we can use the transpose function to do this easily:
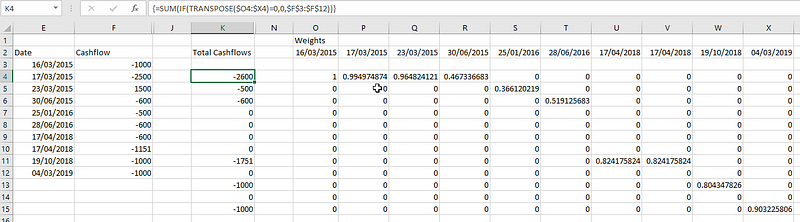
Or calculating the first entry manually as:
=F3+F4+F5+F66. Calculate Periodic Returns
The periodic returns, as the name suggests is the returns for each of our periods that we had captured the portfolio valuation for.
To calculate them, we use the following formulas:
Periodic Returns = (CF_T0 - CF_T1 + TCF_T0) / (CF_T0 - WCF_T0)
where,
CF_T0 refers to the cash flow for the period in hand
CF_T1 refers to the previous recorded cash flow
TCF_T0 refers to the Total cash flow for the period in hand
WCF_T0 refers to the Weighted cash flow in hand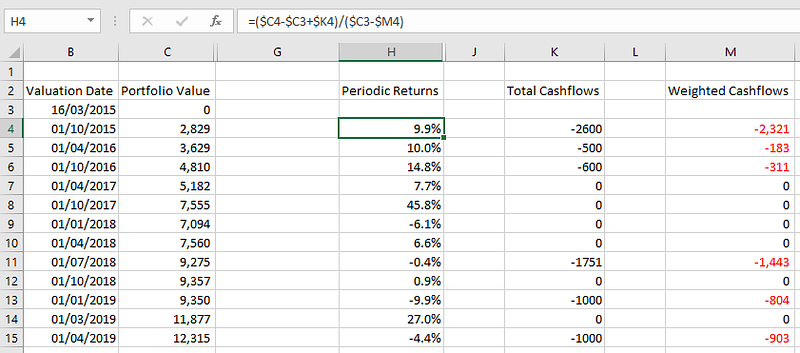
7. Calculate Gross Periodic Returns
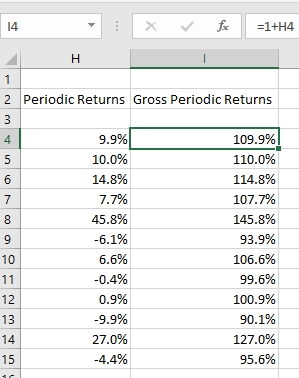
The Gross Periodic Returns are essentially the Periodic Returns but shown as a percentage of the portfolio value. All we need to do, is add 1 to the Periodic Returns.
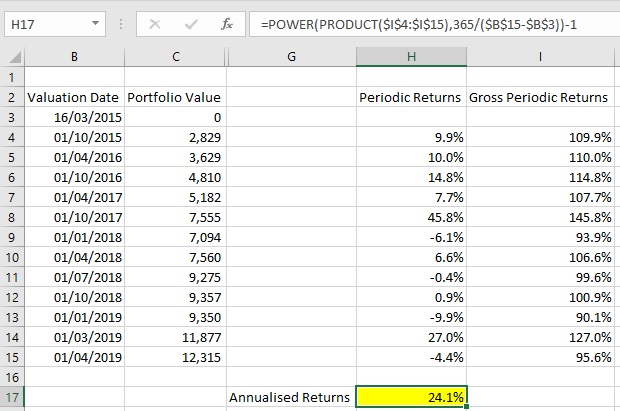
8. Calculate Annualised Returns
To calculate the Annualised Returns, that is the year on year returns that we have, we need to do 3 things:
- Calculate the total return (same as what we did in TWRR)
- Annualise it by raising it to the power of 365/Total Period
- Remember to minus 1
That’s it folks — there you have it. Now you know how to calculate GIPS compliant returns for your personal portfolio. Give it a try and let me know how the markets have treated you over the years!
Before you go, I often blog about finance and technology. If you want to stay up to date with my articles, don’t forget to follow me!